By Money Metals News Service
If we look at certain indicators in the silver market, the price is setting up for a big move. It seems as if mainstream investors are now becoming more worried about the stock and bond markets. With almost $17 trillion in negative-yielding debt in the world, the notion that gold or silver doesn’t earn a yield is starting to look like a better deal than paying someone to own bonds.
Thus, the record increase in negative-yielding debt has push gold, in just the past few months, has been one of the catalysts to push gold above an important six-year resistance level. Furthermore, several articles have stated that gold has reached an all-time high in 73 currencies. However, it will take some time for gold to reach a new high in the U.S. Dollar because the Fed has a monopoly on the world’s printing press.
Now, for silver. While silver hasn’t been in the spotlight like gold, it has actually outperformed the yellow metal over the past three months. Since June, gold peaked at being 18% higher while silver was 20%. But, certain indicators for silver are showing that we may be setting up for an even BIGGER MOVE.
In my newest video, SILVER MARKET: Indicators Setting Up For A Big Move, I explain this in detail with ten charts:
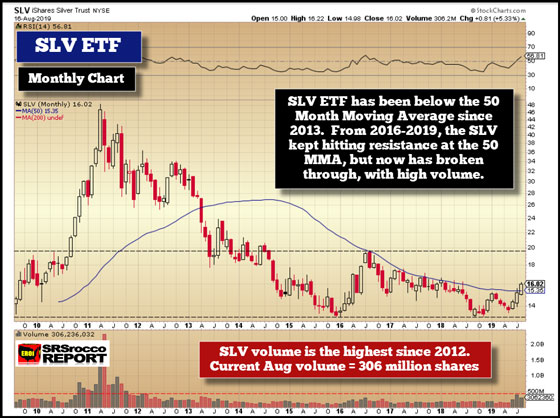
One of the important charts in the video shows how the volume on the SLV ETF has increased significantly and is the highest its been since 2012. Typically, when we see a significant increase in trading volume in a stock or commodity, traders and investors are setting the stage for a larger price move ahead:
Free Reports:
 Get Our Free Metatrader 4 Indicators - Put Our Free MetaTrader 4 Custom Indicators on your charts when you join our Weekly Newsletter
 Get our Weekly Commitment of Traders Reports - See where the biggest traders (Hedge Funds and Commercial Hedgers) are positioned in the futures markets on a weekly basis.

Part of the reason for the increased volume in the SLV ETF, has to do with it finally breaking above the 50 Month Moving Average (Blue Line). The silver price and SLV ETF have been trading below the 50 Month Moving Average (MMA) since 2013. So, a close above this 50 MMA at the end of August would be an excellent sign for traders and investors.
Now, I published the video late on Sunday evening because of positive setup on the Silver Daily chart. I saw a small Ascending Triangle form in the silver price over the past two weeks, and if it broke above that $17.25 level this week, we could easily see another $1.00+ move. However, with the announcement by the German Govt of stimulus plan as well as China’s interest rate reform (published on Zerohedge), the precious metals sold off in late Asian and early European trading.
In my previous video, GOLD & SILVER: Continued Breakout Or Correction, I did say that I thought the precious metals would more than likely experience a correction before moving higher. While the short-term Silver Ascending Triangle did not result in a move higher today or this week, nothing goes up in a straight line.
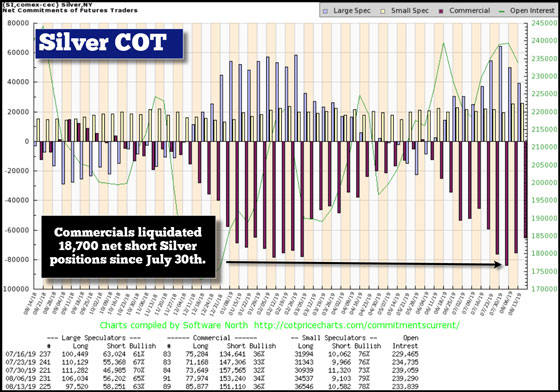
However, even if we don’t see a continued breakout in the silver price this week or next, the medium to longer-term fundamentals and technicals still point to much higher prices over the next 1-2 years. Furthermore, the Silver COT report that came out on Friday reported that the Commercials liquidated 10,000 short positions, even though the silver price increased 50+ cents:

So, the idea that the Commercials will continue to add more shorts as the silver price increases, doesn’t seem to be taking place over the past two weeks. Instead, we see a “consolidation” of Commercial Net short positions to a lower level as the silver price increases.
Lastly, over the weekend, I did an interview with Louis at Smaulgld.com on the silver market. Even though I explained some of the indicators with Louis, I wanted to do a more detailed video. But, Louis adds some interesting information about the tremendous amount of silver moving into the SLV ETF as well as other global silver ETFs. Here is our interview below:
Precious metals investors shouldn’t be concerned with seeing a correction in the gold and silver prices. As I stated, gold could go back down to $1,360 and silver $15.50 before resuming their bullish trend at the end of the summer or beginning of the fall. Of course, they don’t have to correct all the way down to those levels, but we should be surprised if they do.
I will continue to put updates on the Gold and Silver prices, but I plan to put out a very interesting video on the Fundaments in the Silver Market next week that is quite interesting.
 The Money Metals News Service provides market news and crisp commentary for investors following the precious metals markets.