By IFCMarkets
South Africa’s investment rating is confirmed by all major agencies
In this review, we suggest considering the personal composite instrument (PCI) “”South African Rand vs Japanese Yen”. Is there a possibility for the ZARJPY to rise?
Such dynamics are observed in case of the strengthening of the South African rand and the weakening of the Japanese yen. On Tuesday, the Moody’s rating agency confirmed the rating of the South African Republic at Baa3 investment grade. Let us note that ratings by the S&P and Fitch agencies also have an investment grade. On March 28, the South African Reserve Bank kept the rate at the level of 6.75%, noting that current inflation (4.1%) in annual terms is in the target range of 3-6%. This is a positive factor for rand. The Central Bank of South Africa expects an increase in the local economy at the level of 1.3% in the current year. In turn, the Japanese yen, which was previously considered a safe haven asset because of the risks of global trade wars, may weaken amid next US-China trade negotiations and publication of good macroeconomic indicators in these countries. In particular, the ISM manufacturing index for February increased in the US, and in China, the PMI manufacturing index for March.
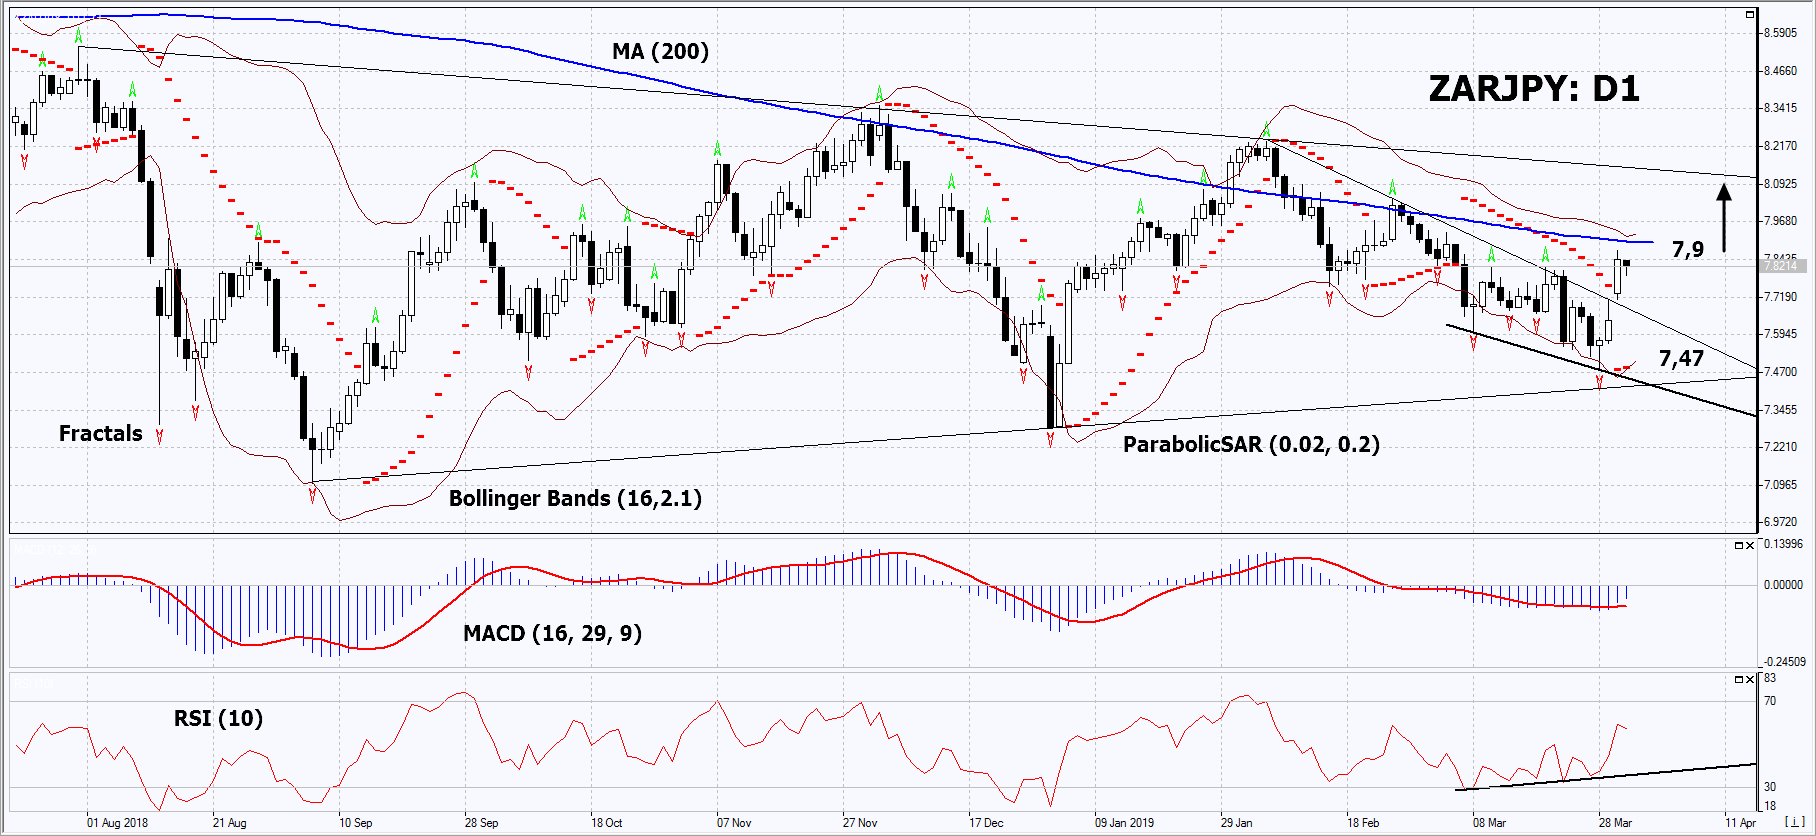
On the daily timeframe, ZARJPY: D1 overcame the resistance line of the short-term downtrend. A number of technical analysis indicators formed buy signals. The further price increase is possible in case of positive macroeconomic data in South Africa and negative ones in Japan.
- The Parabolic Indicator gives a bullish signal.
- The Bollinger bands have widened, which indicates high volatility. Both Bollinger bands are titled upward.
- The RSI indicator is above 50. It has formed a positive divergence.
- The MACD indicator gives a bullish signal.
The bullish momentum may develop in case ZARJPY exceeds the upper Bollinger band and the 200-day moving average line at 7.9. This level may serve as an entry point. The initial stop loss may be placed below the last fractal low, the lower Bollinger band and the Parabolic signal at 7.47. After opening the pending order, we shall move the stop to the next fractal low following the Bollinger and Parabolic signals. Thus, we are changing the potential profit/loss to the breakeven point. More risk-averse traders may switch to the 4-hour chart after the trade and place there a stop loss moving it in the direction of the trade. If the price meets the stop level (7.47) without reaching the order (7.9), we recommend to close the position: the market sustains internal changes that were not taken into account.
Summary of technical analysis
| Position | Buy |
| Buy stop | Above 7.9 |
| Stop loss | Below 7.47 |
Market Analysis provided by IFCMarkets
Free Reports:
 Get Our Free Metatrader 4 Indicators - Put Our Free MetaTrader 4 Custom Indicators on your charts when you join our Weekly Newsletter
 Get our Weekly Commitment of Traders Reports - See where the biggest traders (Hedge Funds and Commercial Hedgers) are positioned in the futures markets on a weekly basis.