By IFCMarkets
Dovish Fed stance bullish for gold
Halting interest rate hikes this year by the Fed is bullish for gold. Will the gold price continue rising?
Federal Reserve’s dovish stance hurts US dollar, making gold more affordable and attractive for investors. At a conclusion of March meeting yesterday the Fed cut the projection of the number of interest rate hikes expected this year to zero from the two forecast in December. This is clearly dovish for the dollar. At the same time policymakers indicated in Fed’s statement that continued US economic growth remains “the most likely” scenario for the US, supporting demand for risky assets – stocks. Continued strength in US stock prices is the major risk for gold. Thus, positive recent data attest to continued strength of US economy while reports US Trade Representative Lighthizer and Secretary of Treasury Mnuchin will visit Beijing next week indicate US and China are in the final stages of trade negotiations. Durable goods orders increase together with construction spending in January were above forecast. The consumer price index rose 0.2% on month in February after three months of no change. Retail sales rose above expected 0.2% over month January, after downwardly revised 1.6% drop in December. And factory orders growth was steady in January. The Federal Reserve decision indicating dovish turn in central bank monetary policy is bullish for gold prices.

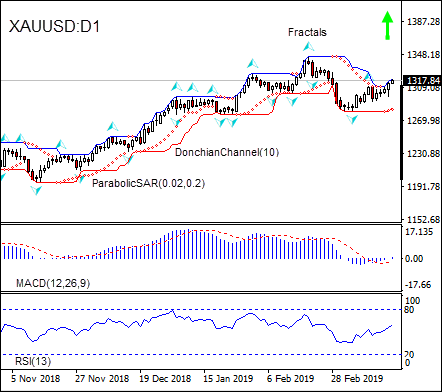
On the daily timeframe the XAUUSD: D1 has been retracing higher after hitting seven-week low in the begging of March.
- The Parabolic indicator gives a buy signal.
- The Donchian channel indicates uptrend: it is widening up.
- The MACD indicator gives a bullish signal: it is above the signal line and the gap is widening.
- The RSI oscillator is rising but has not breached into overbought zone yet.
We believe the bullish momentum will continue after the price breaches above the upper boundary of Donchian channel at 1319.18. This level can be used as an entry point for placing a pending order to buy. The stop loss can be placed below the lower Donchian boundary at 1280.73. After placing the order, the stop loss is to be moved every day to the next fractal low, following Parabolic signals. Thus, we are changing the expected profit/loss ratio to the breakeven point. If the price meets the stop loss level (1280.73) without reaching the order (1319.18), we recommend cancelling the order: the market has undergone internal changes which were not taken into account.
Technical Analysis Summary
| Position | Buy |
| Buy stop | Above 1319.18 |
| Stop loss | Below 1280.73 |
Market Analysis provided by IFCMarkets
Free Reports:
 Get Our Free Metatrader 4 Indicators - Put Our Free MetaTrader 4 Custom Indicators on your charts when you join our Weekly Newsletter
 Get our Weekly Commitment of Traders Reports - See where the biggest traders (Hedge Funds and Commercial Hedgers) are positioned in the futures markets on a weekly basis.