By Dmitriy Gurkovskiy, Chief Analyst at RoboForex
On Monday, February 11, Brent is trading close to 61.50 USD and falling, although bulls were dominating the instrument last Friday.
The number of oilrigs in the USA added 4 units over a week by February 8, up to 1049. In Canada, the same indicator lost 3 units and now equals to 240.
After Baker Hughes published these numbers last Friday, oil prices were still rising slowly, although they had to fall, because the readings were rather bearish.
Everything was quite simple: there were speculations on the oil market, which pushed the price upwards. The US Congress has plans to review a draft law allowing the USA to accuse other countries members of the OPEC in manipulating oil prices. The idea is not new and the Congress discussed it in the past one way or another, but this time this law has more chances to be approved – everyone knows that the US President Donald Trump is very aggressive when it comes to the OPEC.
So, what does the US Congress may really do? In case it is really necessary, the Congress may deprive the OPEC members of sovereign immunity, thus making them vulnerable to accusations in different conspiracies. This is what makes oil prices go up.
Free Reports:
 Get Our Free Metatrader 4 Indicators - Put Our Free MetaTrader 4 Custom Indicators on your charts when you join our Weekly Newsletter
 Get our Weekly Commitment of Traders Reports - See where the biggest traders (Hedge Funds and Commercial Hedgers) are positioned in the futures markets on a weekly basis.
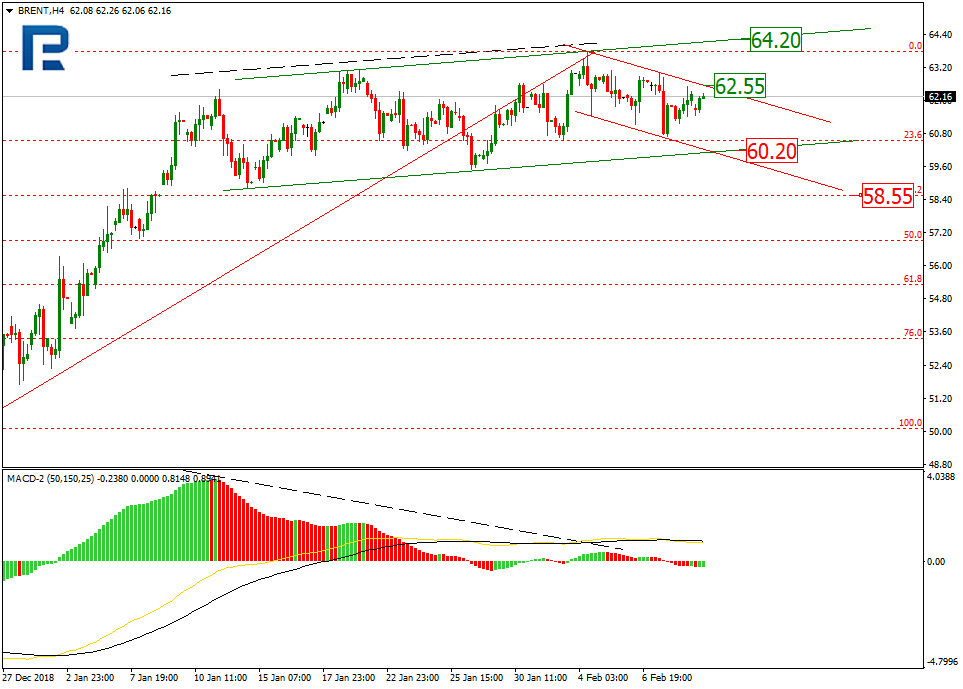
As we can see in the H4 chart, the mid-term tendency is still moving upwards, while the short-term one is trying to go in the opposite direction. The short-term tendency is confirmed by the divergence on MACD, which may indicate the start of a new bearish phase. The closest downside target will be the support line of the mid-term trend at 60.20. If the price breaks this level, the descending tendency may continue to reach the next target at 58.55 (38.2% Fibo). At the same time, the instrument may yet break the local resistance at 62.55 and continue growing towards the mid-term one at 64.20.
In the H1 chart, the price is steadily trading downwards, but there is a convergence on Stochastic Oscillator. In this light, the price may break the resistance line at 62.55.
Disclaimer
Any predictions contained herein are based on the authors’ particular opinion. This analysis shall not be treated as trading advice. RoboForex shall not be held liable for the results of the trades arising from relying upon trading recommendations and reviews contained herein.

