By The Gold Report
Source: John Newell for Streetwise Reports 02/13/2019
Following a painful decline, some quality mining shares are poised for recovery. Fund manager John Newell at Fieldhouse Capital Management explains his process to identify them.
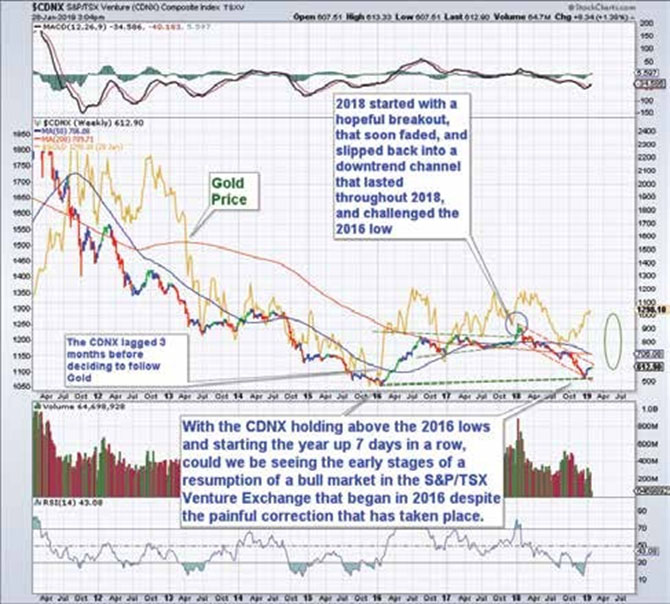
In the larger picture, the first chart shows the CDNX Index, which represents many of the junior mining companies we follow (but not perfectly). They tried to breakout in early 2018 after moving sideways for more than a year and half from the late summer highs of 2016. They then slipped back into a downtrend in early 2018 and then bottomed on December 24, 2018 at 528.

Chart courtesy of StockCharts.com.
Since that low, the index has climbed steadily up, about 13.5% in early 2019. However, what the CDNX chart above hides are the positive moves some companies made in the space, despite the difficult market. So, we will look at the traits of the companies that did well in 2018, for clues on what could continue to work in 2019. But first I will show charts that make us believe that 2019 could be a very good year in the precious metal space.
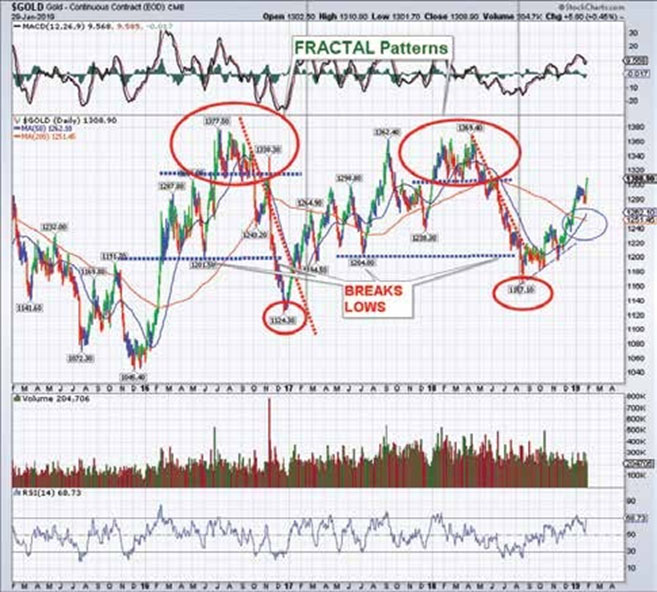
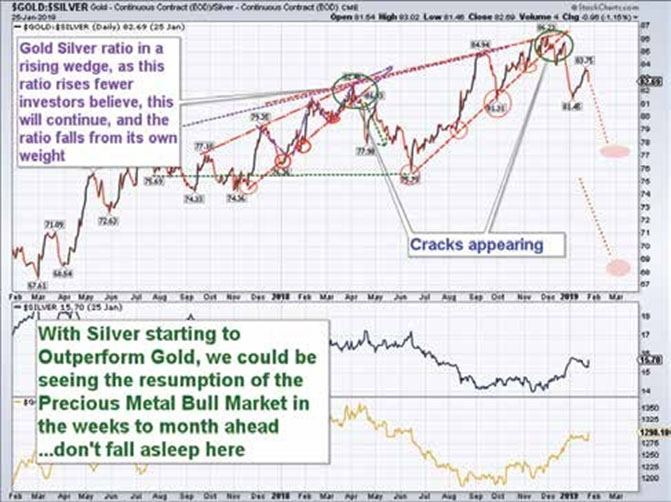
The Gold Chart shows that gold bottomed on August 16, 2018, yet despite a ~10% rise in gold off its lows, precious metal shares lagged, much like 2016. (First posted on August 22, 2018) (The Gold-Silver Ratio is how many ounces of silver it takes to buy one ounce of gold.)
Free Reports:
 Get Our Free Metatrader 4 Indicators - Put Our Free MetaTrader 4 Custom Indicators on your charts when you join our Weekly Newsletter
 Get our Weekly Commitment of Traders Reports - See where the biggest traders (Hedge Funds and Commercial Hedgers) are positioned in the futures markets on a weekly basis.

Chart courtesy of StockCharts.com.
Historically, this ratio suggests that investors are willing to take on more risk when silver is outperforming gold and, therefore, more money goes into the riskier asset classes as the risk on trade takes hold.
When silver rises faster than gold, as it is now, it suggests growth and inflation are rising, giving investors reasons to look at all tangible assets to protect purchasing power.
In the chart on below we are beginning to see silver outperform gold after trading at historical highs.

Chart courtesy of StockCharts.com.
2018: THE PERFECT STORM
It was hard to make money in the last half of 2018 in this sector, with the U.S. imposing tariffs on China, the threat of higher interest rates, the short term strength in the U.S. dollar, coupled with the threat it would go higher, the lack of timely assay results, general investor pessimism, equity raises in a weak market, and lastly, tax loss sellingall contributed to a weak year overall.
The shotgun approach or a lot of names, ETFs, or precious metal funds did not do well in 2018. However, in stealth-like fashion, the tricky precious metal space had some big winners, and it was the rifleman’s approach in 2018 that did well, but it required work.
In 2018, we saw the takeovers of Nevsun, Dalradian, Northern Empire, Richmont and Klondex, to name a few. We saw exploration success with Sun Metals, Corvus, Westhaven, Great Bear and GT Gold. All the names, and I have missed some, were either taken over, had good exploration success or were part of jurisdictional diversification or consolidations of existing land positions (area plays), where property synergies made sense, as reasons for the share prices going higher.
2019: THE PERFECT OPPORTUNITY
First, we make a few assumptions. In the 1990s, gold companies found about 1.4 ounces of gold for every ounce they produced. Today, that number has dwindled to 0.03 ounces for every ounce produced and peak gold, by consensus numbers, took place in 2015. This is a recipe for going out of business if you don’t find, buy or merge more ounces into these companies to increase production or add to reserves.
So, it is with that in mind that we believe in the same approach we used in 2018, that is, careful research, looking at quality committed management teams, good properties in sound jurisdictions, a strategic large shareholder, some money in the bank and a reasonable timetable for news and results as we start to look for investments in the mining sector for 2019.
As we start 2019, exploration companies are priced for failure. The threat of more U.S. dollar strength and higher interest rates seem overblown and investor pessimism and doubts are high. However, this appears to be fertile ground for a new leg up in the on-going bull market in precious metals, base metals and strategic metals going forward.
WHAT WE DO
We start by screening approximately 1,500 companies, looking for long bases, accumulation patterns or a bullish technical formation that gives us a clue to where investor interest is or where investor interest could be going. Shares in companies that hold up better in down markets is also a big clue.
We then we go to conferences, road shows, meet with the company executives, and maybe even do site visits, meet the prospectors and geologists to get a feel for the company and its personal. We build on the fundamental story and opportunity and have technical targets where we see the share price potentially going.
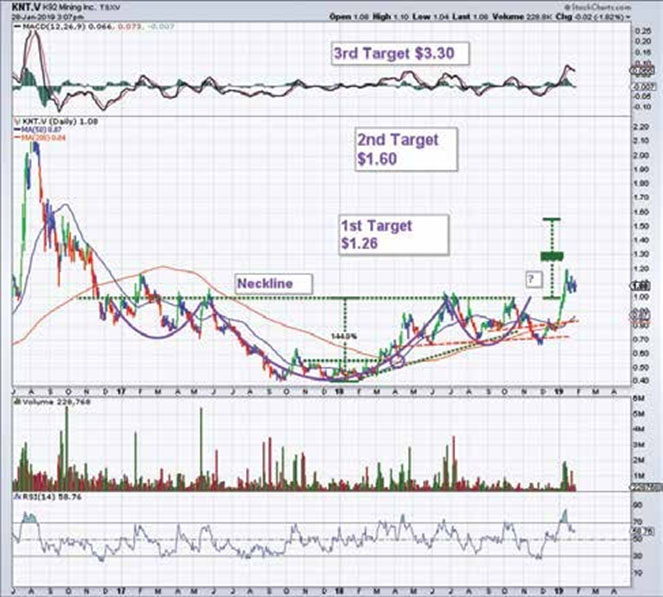
We like to share the companies we like in pictures and the chart below is a good current representation of the kind of company we like. While this is not a stock recommendation, it represents all that we look for in a companygreat management, good jurisdiction, good grades, improving cash flows, exploration success and a good solid base in the stock chart that helps us to know that most of the weak hands have left the market and the float has tightened up.

Chart courtesy of StockCharts.com.
IN SUMMARY
We believe the junior mining space offers a rare opportunity as a contrarian investment thesis, with many good, well run companies trading at significant discounts. Also, with the seasonal play not too far off, as we go to press, timely investments in this sector could prove rewarding in 2019 for investors willing to do their homework.
John Newell is a portfolio manager at Fieldhouse Capital Management. He has 38 years of experience in the investment industry acting as an officer, director, portfolio manager and investment advisor with some of the largest investment firms in Canada. Newell is a specialist in precious metal equities and related commodities and is a registered portfolio manager in Canada (advising representative).
This article was initially published in the February/March 2019 issue of
Resource World. Reprinted by permission.
Sign up for our FREE newsletter at: www.streetwisereports.com/get-news
Disclosures:
1) John Newell: I, or members of my immediate household or family, own shares of the following companies mentioned in this article: None. I personally am, or members of my immediate household or family are, paid by the following companies mentioned in this article: None. My company currently has a financial relationship with the following companies mentioned in this article: None. I determined which companies would be included in this article based on my research and understanding of the sector. Additional disclosures/disclaimer below.
2) The following companies mentioned in this article are sponsors of Streetwise Reports: Great Bear Resources. Click here for important disclosures about sponsor fees.
3) Comments and opinions expressed are those of the specific experts and not of Streetwise Reports or its officers. The author is wholly responsible for the validity of the statements. The author was not paid by Streetwise Reports for this article. Streetwise Reports was not paid by the author to publish or syndicate this article. The information provided above is for informational purposes only and is not a recommendation to buy or sell any security. Streetwise Reports requires contributing authors to disclose any shareholdings in, or economic relationships with, companies that they write about. Streetwise Reports relies upon the authors to accurately provide this information and Streetwise Reports has no means of verifying its accuracy.
4) The article does not constitute investment advice. Each reader is encouraged to consult with his or her individual financial professional and any action a reader takes as a result of information presented here is his or her own responsibility. By opening this page, each reader accepts and agrees to Streetwise Reports’ terms of use and full legal disclaimer. This article is not a solicitation for investment. Streetwise Reports does not render general or specific investment advice and the information on Streetwise Reports should not be considered a recommendation to buy or sell any security. Streetwise Reports does not endorse or recommend the business, products, services or securities of any company mentioned on Streetwise Reports.
5) From time to time, Streetwise Reports LLC and its directors, officers, employees or members of their families, as well as persons interviewed for articles and interviews on the site, may have a long or short position in securities mentioned. Directors, officers, employees or members of their immediate families are prohibited from making purchases and/or sales of those securities in the open market or otherwise from the time of the interview or the decision to write an article, until one week after the publication of the interview or article.
Additional Disclosures and Disclaimer from John Newell, Fieldhouse Capital Management
Legal Notice / Disclaimer:
This document is not and should not be construed as an offer to sell or the solicitation of an offer to purchase or subscribe for any investment.
John Newell has based this document on information obtained from sources he believes to be reliable, but which has not been independently verified.
John Newell makes no guarantee, representation or warranty and accepts no responsibility or liability as to its accuracy or completeness. Expressions of opinion are those of John Newell only and are subject to change without notice. John Newell assumes no warranty, liability or guarantee for the current relevance, correctness or completeness of any information provided within this Report and will not be held liable for the consequence of reliance upon any opinion or statement contained herein or any omission.
Furthermore, I, John Newell, assume no liability for any direct or indirect loss or damage or for lost profit, which you may incur because of the use and existence of the information provided within this Report.
It should not be assumed that the methods, techniques, or indicators presented in these pages will be profitable or that they will not result in losses. Past results are not necessarily indicative of future results. Examples presented on these pages are for educational purposes only. These set-ups are not solicitations of any order to buy or sell. The authors, the publisher, and all affiliates assume no responsibility for your trading results. There is a high degree of risk in trading.
Hypothetical and historical performance results have many inherent limitations, some of which are described below. No representation is being made that any account will or is likely to achieve profits or losses similar to those shown. In fact, there are frequently sharp differences between hypothetical and historical performance results and the actual results subsequently achieved by any trading program. One of the limitations of hypothetical and historical performance results is
that they are generally presented with the benefit of hindsight. In addition, hypothetical and historical trading may not present the financial risks and returns for future trading. For example, the ability to withstand losses or to adhere to a particular trading program in spite of trading losses are material points which can also adversely affect trading results. There are numerous other factors related to the markets in general or to the implementation of any specific trading program which
cannot be fully accounted for in the preparation of hypothetical performance results and all which can adversely affect actual trading results.
Disclaimer: This Publication is protected by Canadian and International Copyright laws. All rights reserved. No license is granted to the user except for the user’s personal use. No part of this publication or its contents may be copied, downloaded, stored in a retrieval system, further transmitted, or otherwise reproduced, stored, disseminated, transferred, or used, in any form or by any means without prior written permission. This publication is proprietary.
Neither the information, nor any opinion expressed constitutes a solicitation for the purchase of an investment program. Any further disclosure or use, distribution, dissemination or copying of this message or any attachment is strictly prohibited; such information, whether derived from Fieldhouse Capital Management or from any oral or written communication by way of opinion, advice, or otherwise with a principal of the company is not warranted in any manner whatsoever, is for the use
of our customers only and may be obtained from internal and external research sources considered to be reliable.
Charts provided by the author.