By Money Metals News Service
While December was a horrible month for the broader markets, that wasn’t the case for the precious metals. As the Dow Jones and S&P 500 Indexes suffered the worst December since the Great Depression, the silver price enjoyed quite a healthy rally. The notion of rising precious metals prices during a market selloff ran counter to most analysts who forecasted falling asset values across the board.
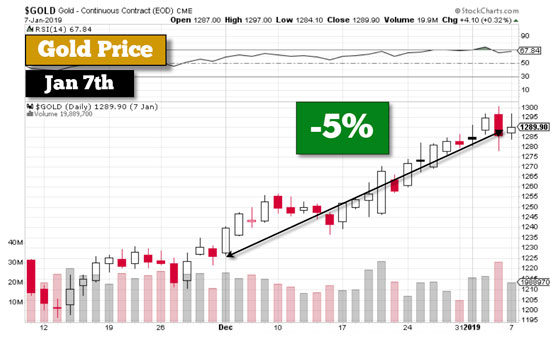
However, that’s exactly what took place in December. I stated, since the beginning of 2018, that when the markets really started to decline the precious metals would likely disconnect and rally higher. Over the past month, the silver price jumped by 10% and gold 5%, while most of the broader indexes, base metals, and energy suffered declines.
For example, the Dow Jones Index fell 9% since December 1st, even though it has rallied from its low on Christmas Eve:
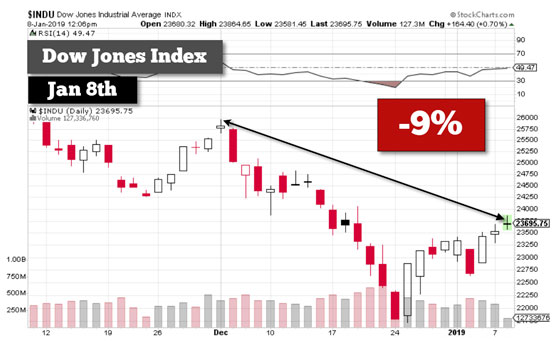
At its low on Christmas Eve, the Dow Jones Index fell a stunning 16% in a little more than three weeks. Currently, the Dow is attempting to retest its 25 Day moving average (MA) and the 24,000 resistance level which I have shown in previous charts. If we look at the graph below, we can see that the Dow finally touched the 25 Day MA today:
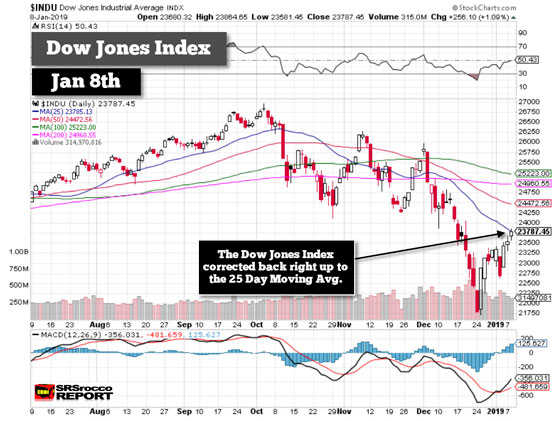
It will be interesting to see what the Dow does tomorrow, but at some point, the broader markets will reverse and continue to sell off.
Free Reports:
 Get Our Free Metatrader 4 Indicators - Put Our Free MetaTrader 4 Custom Indicators on your charts when you join our Weekly Newsletter
 Get our Weekly Commitment of Traders Reports - See where the biggest traders (Hedge Funds and Commercial Hedgers) are positioned in the futures markets on a weekly basis.
I must say, watching Intra-Day trading of the markets, stocks, metals, commodities, and energy has been quite eye-opening. Yes, I still follow the fundamentals as they are the true factors that guide the markets, but technical analysis provides us a “CRYSTAL BALL” on price trend movements. I will explain at the end of the article, but let’s look at the next following charts.
The oil price has also been falling along with the broader markets. Even though the U.S. West Texas Intermediate oil price peaked at the beginning of October, it dropped another 8% over the past month:
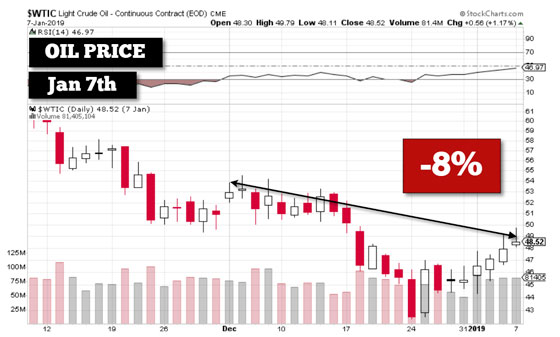
Now, it is quite amazing how the oil price also fell to its low along with the Dow Jones on Christmas Eve and then shot up higher the next trading day. I will be explaining this in more detail in a new video update, but I believe the oil price will attempt to move back up to $52 level before reversing lower.
Please note, these charts were done early today before the market close, so the metals and energy prices are reflective of Jan 7th (Monday) trading.
The next chart is quite surprising because it usually trends with silver. Because copper is the king base metal and a major indicator of the industrial sector, it provides an important gauge of the health of the economy. The silver and copper prices tend to move together as they are both industrial metals. However, the copper price has fallen 7% since Dec 1st while silver rose by 10%:
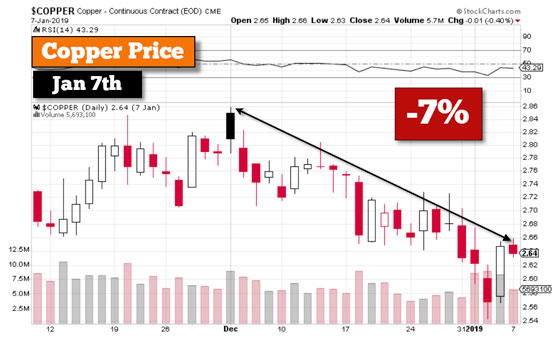
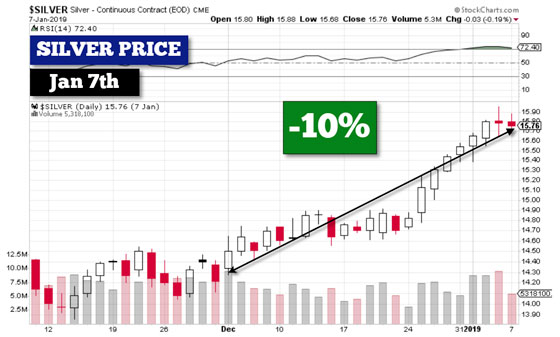
What a disconnect… ah? As I mentioned, the majority of technical analysts forecasted that the precious metals would fall with the broader markets, but as we can see, quite the opposite took place. While gold’s increase of 5% over the same period was half that of silver, at least it also outperformed the majority of assets in the market:
While the precious metals have done relatively well compared to most other assets this past month, I believe we are just seeing the beginning stages of much higher gold and silver prices over the next few years. The broader markets have only begun their massive correction lower even though some analysts are suggesting the BOTTOM is in.
How on earth can the bottom of the Dow Jones Index be in when it hasn’t even fallen back to its 50 Month MA (BLUE LINE)?
As we can see, the SPY Index trades off of technical levels shown below:
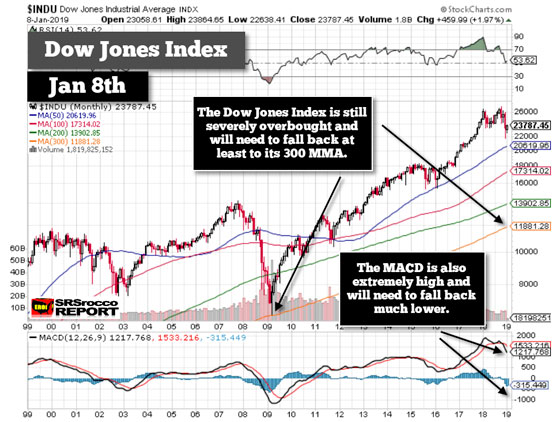
As I have mentioned in previous articles and videos, the Dow will likely fall back at least to its 300 MMA (ORANGE LINE). thus, when the Dow starts ripping down through its lower moving averages that is when FEAR will begin to really motivate investors into gold and silver.
 The Money Metals News Service provides market news and crisp commentary for investors following the precious metals markets.