EURUSD Forex Analysis: ECB may continue quantitative easing
By IFCMarkets
ECB may continue quantitative easing
The euro fell slightly on Friday after the head of the Bank of Finland and ECB member Olli Rehn announced that the European Central Bank could launch a new quantitative easing program (TLTRO), if needed. Is there a possibility for the further decrease in the euro?
Targeted Long-Term Refinancing Operations (TLTRO) is a quantitative easing program and the analogue of the US Federal Reserve QE programs. It implies money emission for the buyout of bonds of EU countries in the amount of 60 billion euros per month. This program was first launched in March 2015. In early autumn, ECB representatives allowed its completion at the end of the current year. The new TLTRO may become relevant amid the budget crisis in Italy. It lies in the fact that the Italian government wants to increase the volume of loans to finance social programs, despite the slowdown in the growth of budget revenues. Eventually, in 2019, the budget deficit could reach 2.4% of Italian GDP. Earlier, the ECB President Mario Draghi and the head of the Bank of France Villeroy de Galhau announced the possibility of launching an additional quantitative easing program, but did not indicate its assumed parameters. On Friday, in an interview with Austrian media, European Commission President Jean-Claude Juncker allowed Italy to leave the Eurozone, but he called it “suicide” for the Italian economy.


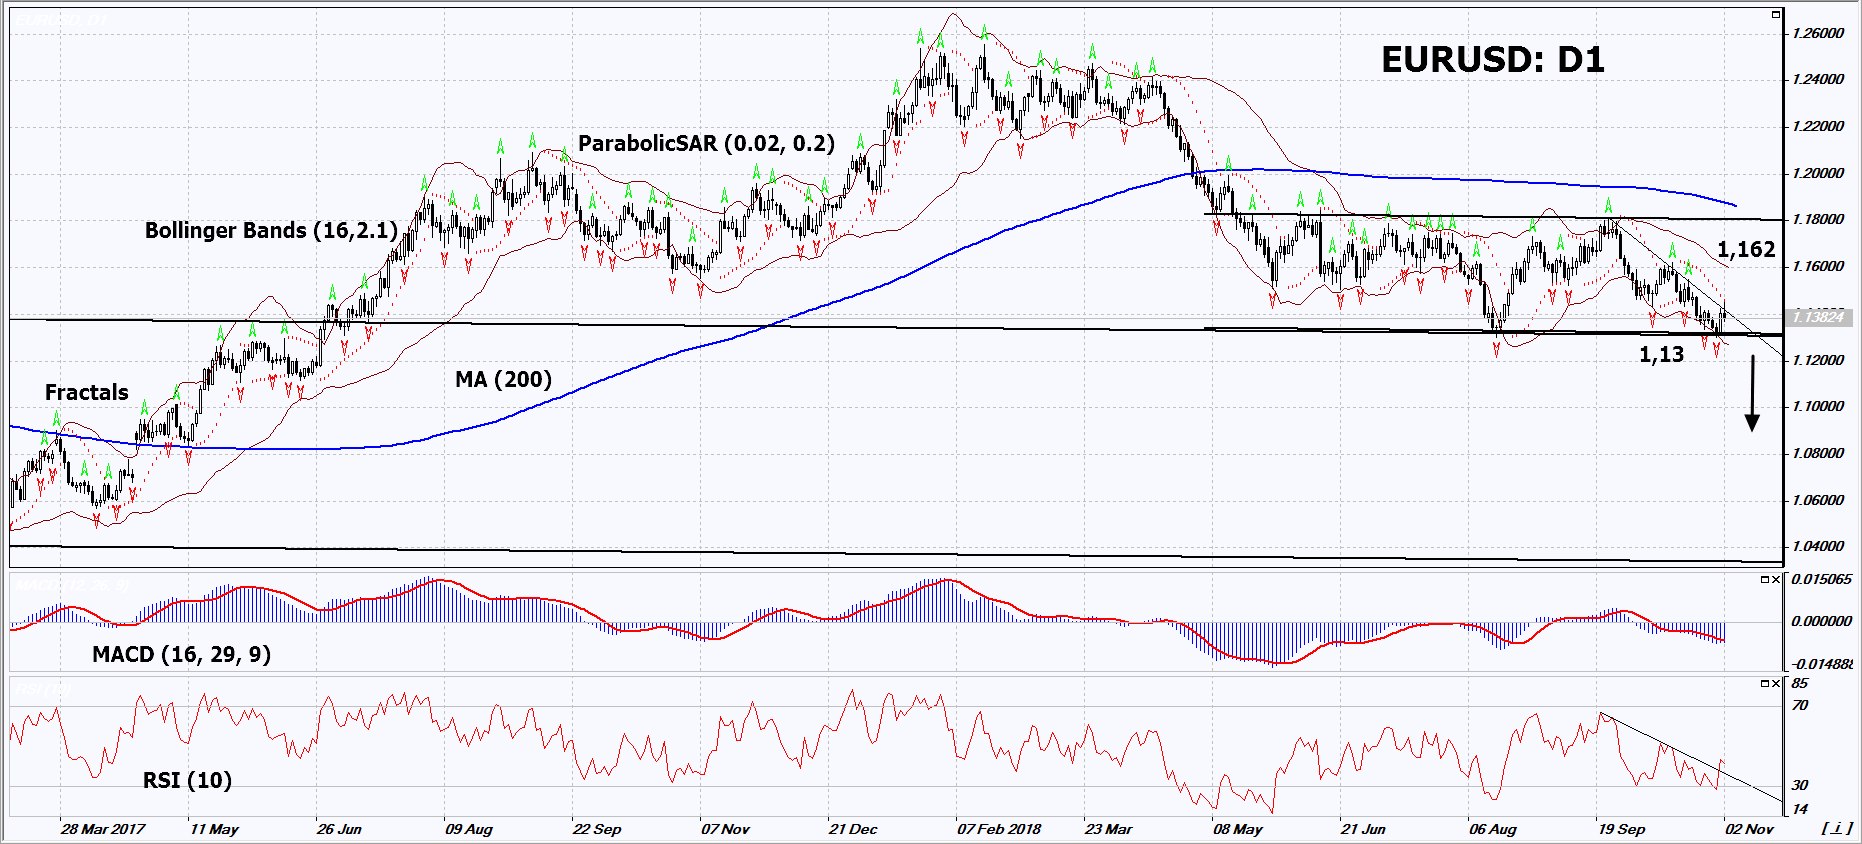
On the daily timeframe, EURUSD: D1 approached the support line of the medium-term neutral range. It was simultaneously the resistance line of the previous neutral range. Such a combination on the chart may suggest a strong movement in case of a breach below the specified line. The downward trend may develop in case of the aggravation of the budget crisis in Italy and other EU countries.
- The Parabolic indicator gives a bearish signal.
- The Bollinger bands have narrowed, which means low volatility. Both bands are titled down.
- The RSI indicator is below 50. No divergence.
- The MACD indicator gives a bearish signal.
The bearish momentum may develop in case EURUSD falls below its last fractal low and the support – resistance lines of two neutral ranges at 1.13. This level may serve as an entry point. The initial stop loss may be placed above the two last fractal highs, the Parabolic signal and the upper Bollinger band at 1.162. After opening the pending order, we shall move the stop to the next fractal high following the Bollinger and Parabolic signals. Thus, we are changing the potential profit/loss to the breakeven point. More risk-averse traders may switch to the 4-hour chart after the trade and place there a stop loss moving it in the direction of the trade. If the price meets the stop level (1.162) without reaching the order (1.13), we recommend cancelling the position: the market sustains internal changes that were not taken into account.
Summary of technical analysis
| Position | Sell |
| Sell stop | Below 1,13 |
| Stop loss | Above 1,162 |
Market Analysis provided by IFCMarkets
Free Reports: