XOM/BRENT Analysis – Preparing for publication of Exxon Mobil quarterly earnings
By IFCMarkets
Preparing for the publication of quarterly earnings reports
In this review, we suggest considering the personal composite instrument (PCI) XOM_Brent. It reflects the price dynamics of stocks of the US oil company Exxon Mobil Corporation against the physically delivered Brent crude oil futures contract. Will XOM_Brent prices rise?
The growth of this PCI means that Exxon Mobil stock prices are rising faster than oil. This may happen amid financial results of the oil company for the 3rd quarter of 2018, which will be published on November 2, 2018. Some investors expect them to be even more positive than in the 2nd quarter of the current year, when the net profit of Exxon Mobil rose to $3.95 billion compared with $3.35 billion in the 2nd quarter of 2017. In the 3rd quarter of 2018, the net profit is expected to increase to $5.2 billion, compared to nearly $4 billion in the same period of 2017. In turn, Brent prices are correcting down amid expectations of an increase in oil production in Saudi Arabia, Russia and other countries. According to market participants, it will fully compensate the possible reduction in its production in Iran due to the 2nd stage of US sanctions that will come into force in the beginning of November. In addition, oil prices are under pressure of the demand reduction risks amid the emerging slowdown in the global economy.

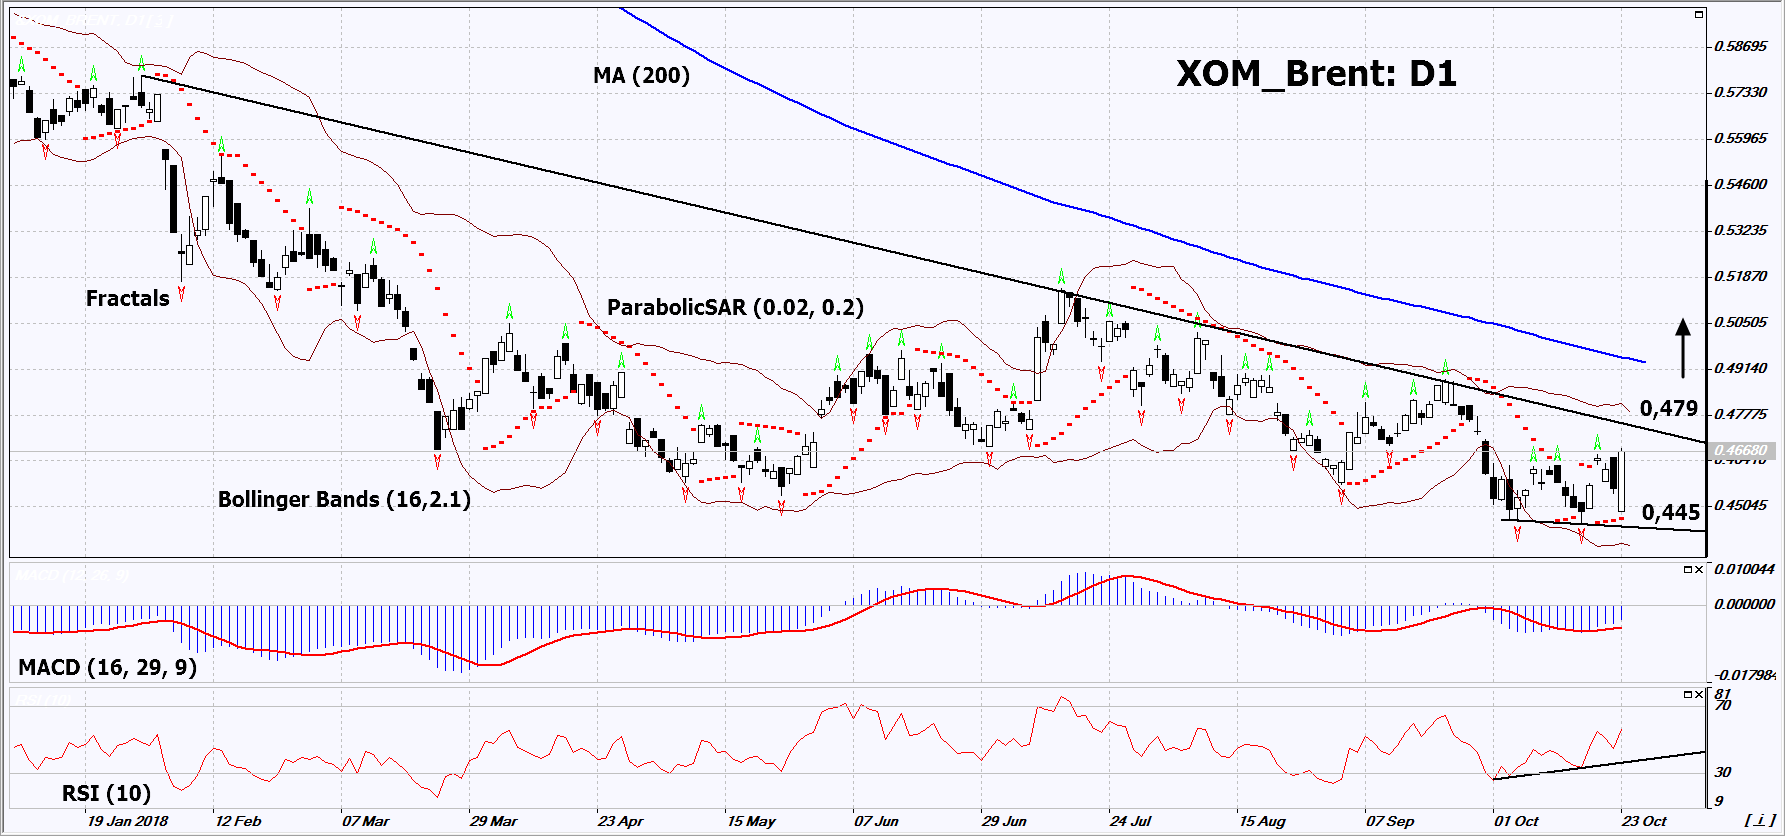

On the daily timeframe, XOM_Brent: D1 is in a downtrend. The decline has slowed down and technical analysis indicators have formed buy signals. Before opening a buy position, it is necessary to breach up the resistance line of the downtrend. The further price increase is possible in case of an increase in Exxon Mobil stocks amid the correction in world oil prices.
- The Parabolic indicator gives a bullish signal.
- The Bollinger bands have widened, which indicates high volatility.
- The RSI indicator is above 50. It has formed a positive divergence.
- The MACD indicator gives a bullish signal.
The bullish momentum may develop in case XOM_Brent exceeds the three last fractal highs and the upper Bollinger band at 0.479. This level may serve as an entry point. The initial stop loss may be placed below the last fractal low, the low since September 2014, the lower Bollinger band and the Parabolic signal at 0.445. After opening the pending order, we shall move the stop to the next fractal low following the Bollinger and Parabolic signals. Thus, we are changing the potential profit/loss to the breakeven point. More risk-averse traders may switch to the 4-hour chart after the trade and place there a stop loss moving it in the direction of the trade. If the price meets the stop level (0.445) without reaching the order (0.479), we recommend to close the position: the market sustains internal changes that were not taken into account.
Summary of technical analysis
| Position | Buy |
| Buy stop | Above 0.479 |
| Stop loss | Below 0.445 |
Market Analysis provided by IFCMarkets
Free Reports:
