By Money Metals News Service
While the precious metals are totally off the radar by the majority of investors, silver is setting up for one major bull market. Yes, it’s hard to believe as the gold and silver prices have been trending lower while the broader markets grind up higher, but if we look at the fundamental and technical indicators, the stock market and precious metals are now at extreme opposites.
The situation in the silver market is so much more favorable today than when it was trading at $20 at the peak in 2007. I will go one step further and say that the current silver indicators are even better than when the silver price fell to $9 towards the end of 2008.
If we look at the Dow Jones-Silver Ratio, it is at a much higher level today than what it was in 2007 or 2008:
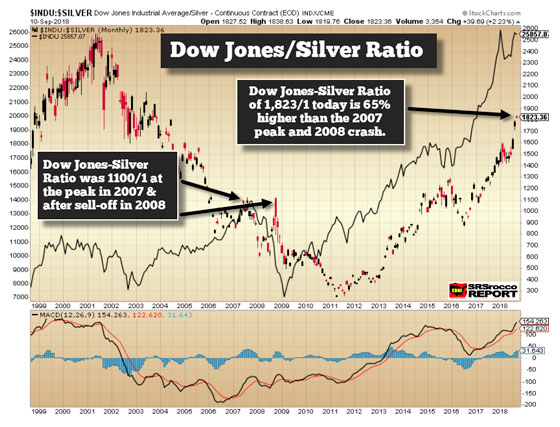
When the Dow Jones Index reached a high of 14,000 in July 2007, silver was trading at $12.75 an ounce. Thus, we had a 1,100-1 Dow Jones-Silver Ratio. An investor could purchase 1,100 oz of silver for the Dow Jones that month. However, as the price of silver shot up over $20 in 2008, the Dow Jones-Silver Ratio fell to a low of 600-1. Once the markets started to sell off and as the silver price dropped to $9 in October 2008, the Dow Jones-Silver Ratio went back up to 1,100-1.
Now, if you look at the where the Dow Jones-Silver Ratio is today, it’s at a high of 1,823-1. Thus, the Dow Jones-Silver Ratio is 65% higher than it was when silver was trading at $9 in October 2008. I don’t believe precious metals investors realize just how extreme this indicator has become.
Free Reports:
 Get Our Free Metatrader 4 Indicators - Put Our Free MetaTrader 4 Custom Indicators on your charts when you join our Weekly Newsletter
 Get our Weekly Commitment of Traders Reports - See where the biggest traders (Hedge Funds and Commercial Hedgers) are positioned in the futures markets on a weekly basis.
I also wanted to update the long-term Dow Jones and Silver charts. I have spent more time understanding technical analysis, and I can tell you that it does impact the markets when retail and professional investors trade based on technical indicators. Of course, it doesn’t change the fundamental reason to own precious metals due to the ongoing disintegration of the financial system via massive money printing and debt.
However, technical analysis does provide SOME CLUES on how the market is changing. And when investors rotate out of one sector or industry and into another, then we will see volume and price react in a profound way. Currently, the retail and professional traders (for the most part) are not interested in gold or silver. But, that will change.
In looking at the Dow Jones and Silver chart and their 200 Month Moving Averages, we can see they continue to move in opposite directions:
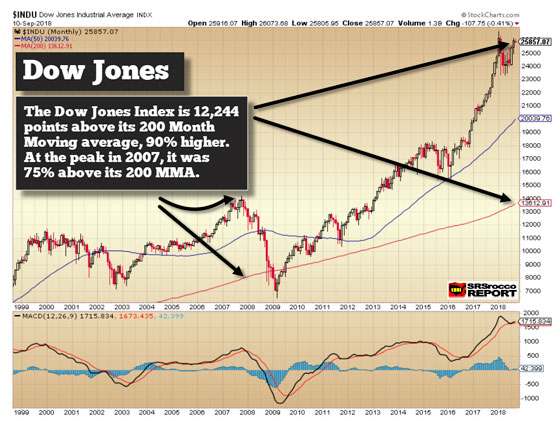
The Dow Jones Index is now 90% above its 200 Month Moving Average (MMA). Yes, there is a 200 MMA when we use a “monthly chart.” If I use a daily chart, then we have a 200 Day moving average, and if I use a weekly chart, then we have a 200 Week moving average. Using a monthly chart and a 200 MMA provides us Birds-Eye view of the markets. For the Dow Jones Index to fall back to its 200 MMA, it would need to drop 12,250 points.
On the other hand, the silver price is currently 13% BELOW its 200 MMA:
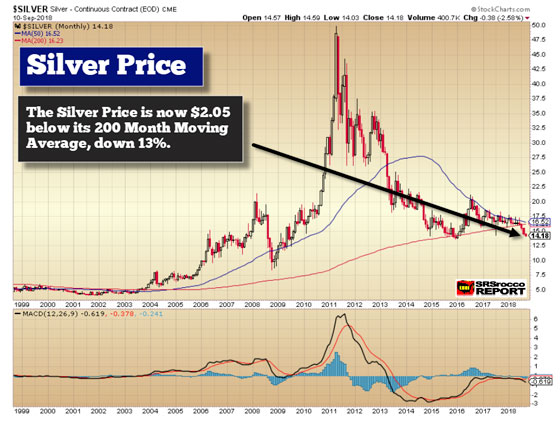
As I have stated many times, the silver price of $14.18 today is set up much differently than when it was trading at $20 in 2008 before the markets crashed. And if we look at the Commercial hedgers, they are now NET LONG silver for the first time in over 25 years:
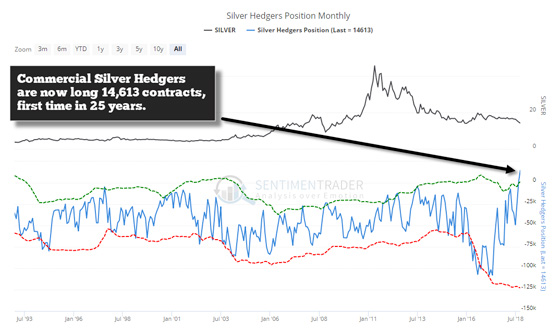
The Commercials are now net long silver by 14,613 contracts while the Speculators are net short by 25,000 contacts, another record. What this chart is telling me is that silver is so FAR off the RADAR that Commercials are now becoming bullish while the Speculators are becoming bearish. This is quite a change as the Speculators were net long silver by 50,000 contracts just three months ago.
And if we look at Silver Sentiment, it is also at a record low:
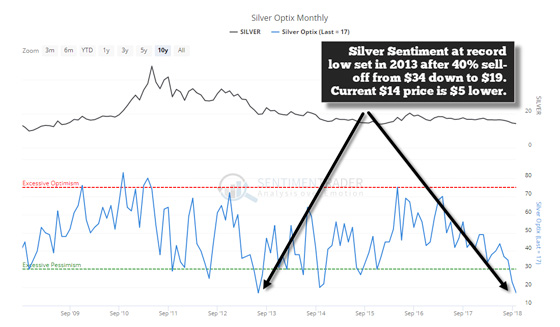
When the silver price fell from $34 down to $19 during the end of 2012 and into the summer of 2013, silver sentiment reached a record low of “17”, below the 30 level which indicates “extreme pessimism.” Today, the silver sentiment is back down to the 17 level once again, but the difference is that the silver price is $5 lower than it was in 2013.
In looking at these charts, the indicators suggest that silver is both excessively oversold and disliked. When a stock or commodity is in favor, then it moves up towards the “excessive optimism” level. So, not only is the silver price well below its 200 MMA, its also at a record low sentiment reading.
However, this doesn’t mean that the silver price can’t trend lower. Even though the silver price could continue to weaken, it is setting up for a significant reversal higher whereas the markets will turn down severely. I have to say; this current precious metals-stock market structure is one I have never seen before. Normally, when the stock markets sell off, so do commodities and the precious metals.
Now, the only time when the precious metals disconnected from the markets was during the 1970’s inflationary period, and commodities such as oil and copper increased along with gold and silver from 1971 to 1980.
Today, investors are focused on the stock indexes, FANG stocks, Real Estate, Bonds, and what’s left of the Crypto market. But, when the markets finally correct lower, there aren’t too many alternative investments to protect the mighty gains made in the stock market. I believe investors will begin to rotate back into the precious metals sector during the next bear market in stocks and real estate.
However, when the retail and professional investors rotate back into the precious metals sector, the amount of interest and volume will likely be nothing we have witnessed before. Why? Well, it has to do with the over-leveraged and highly indebted financial system that we have today than in any other time in history.
As I mentioned in my previous article, the U.S. public debt continues to surge higher, which is impacting the interest the Treasury has to pay on that debt. The U.S. Government debt service will easily surpass $500 billion this and will likely be over $520 billion. But, what happens when the U.S. Government loses control over the low 2.3% average interest rate that it’s paying to service its debt. If it just doubles to 5%, then the annual interest expense jumps to $1 trillion.
While it has been frustrating to watch the precious metals prices trend lower over the past seven years while seemingly everything else (minus the cryptos) continues to grind higher, patience will finally pay off to investors who understood the reason to purchase and hold gold and silver.
Lastly, to those individuals who believe the precious metals won’t experience another bull market for another decade or two, similar to the 1983-2003 period, we had the energy to drive global economic. However, this time around, we won’t have the energy to pull us out of the next recession-depression. Thus, another excellent reason to protect wealth with gold and silver.
 The Money Metals News Service provides market news and crisp commentary for investors following the precious metals markets.