USDCAD Analysis: Market participants expect an acceleration in Canadian economy
By IFCMarkets
Market participants expect an acceleration of the increase in the Canadian economy
A number of positive economic data came out in Canada. Is there a possibility for the Canadian dollar to strengthen? On the USDCAD chart, it looks like a decline.
In July 11, 2018, the Bank of Canada raised the rate to 1.5% from 1.25%. Economic statistics show that such a policy can continue. In particular, inflation in June rose to 2.5%, which is the 6-year high. In Canada, the wholesale trade for May grew by 1.2%. Investors expect a 2.5% -3% increase in the Canadian GDP in the second quarter year over year, after an increase by 1.3% in the first quarter. The spread of the US and Canadian 2-year bond yield is at the lowest level (62.5 basis points). The US inflation is not much lower than the Canadian one and is equal to 2.3%. Stable high world oil prices and progress in the discussion of the North American Free Trade Agreement may be an additional positive factor for the Canadian dollar. US President Donald Trump recently stated the importance of an early revision of the terms of the North American Free Trade Agreement (NAFTA).

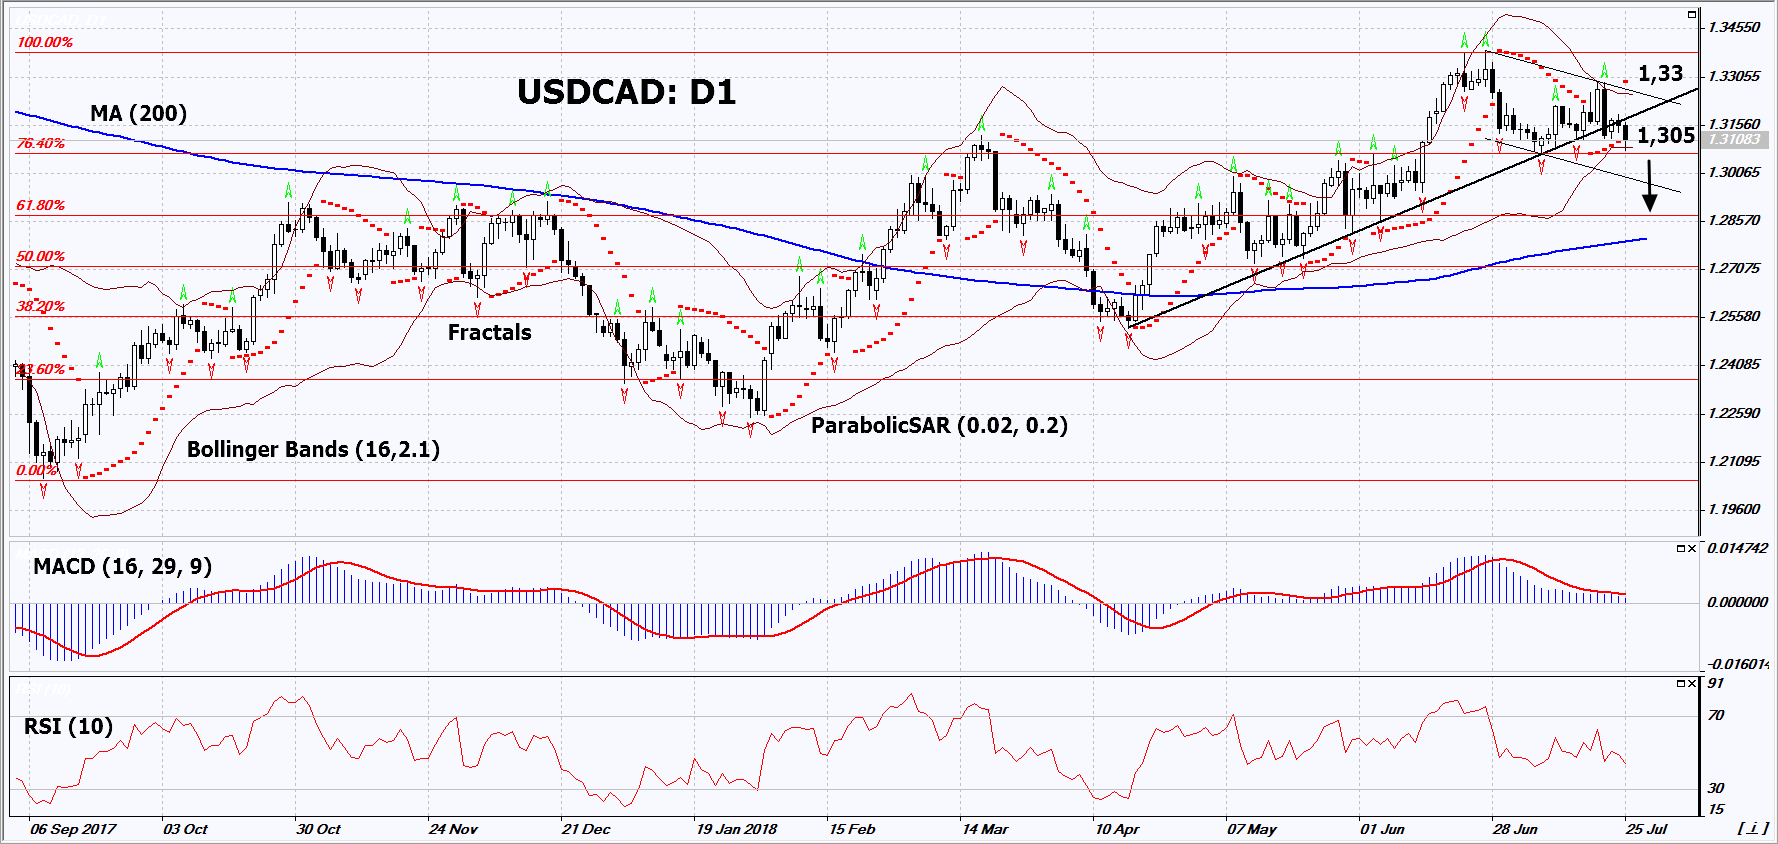

On the daily timeframe, USDCAD: D1 breached down the support line of the uptrend. Positive economic data and progress in NAFTA negotiations can contribute to the price decrease.
- The Parabolic indicator gives a bearish signal.
- The Bollinger bands have narrowed, which indicates low volatility. The upper band is titled downward.
- The RSI indicator is below 50. No divergence.
- The MACD indicator gives bearish signals.
The bearish momentum may develop in case USDCAD falls below its two last fractal lows and the lower Bollinger band at 1.305. This level may serve as an entry point. The initial stop loss may be placed above the last fractal high, the upper Bollinger band and the Parabolic signal at 1.33. After opening the pending order, we shall move the stop to the next fractal high following the Bollinger and Parabolic signals. Thus, we are changing the potential profit/loss to the breakeven point. More risk-averse traders may switch to the 4-hour chart after the trade and place there a stop loss moving it in the direction of the trade. If the price meets the stop level (1.33) without reaching the order (1.305), we recommend to close the position: the market sustains internal changes that were not taken into account.
Summary of technical analysis
| Position | Sell |
| Sell stop | Below 1.305 |
| Stop loss | Above 1.33 |
Market Analysis provided by IFCMarkets
Free Reports:
