By IFCMarkets
The Bank of England can raise the rate
According to interest rate futures, the probability of a rate hike by the Bank of England at its next meeting on Thursday, August 2, 2018 is 86%. Will the British pound exchange rate rise?
The results of the meeting will be announced at 13:00 CET. A rate hike by 0.25% from 0.5% to 0.75% is expected. The main reason for its increase is high inflation in the UK, which is 2.4% year over year. This is higher than the 2% target level of the Bank of England. Theoretically, such inflation can contribute to the further rate hike, which can increase the demand for British pounds. In the 2000s, the rate of the Bank of England fluctuated from 6% to 3.5%, after which it was reduced to 0.5% in 2009 and later to a 0.25% historic low in 2016. After that, in December 2017 there was a rate hike from 0.25% to the current level of 0.5%. The historic high rate of the Bank of England was 17% in 1980.
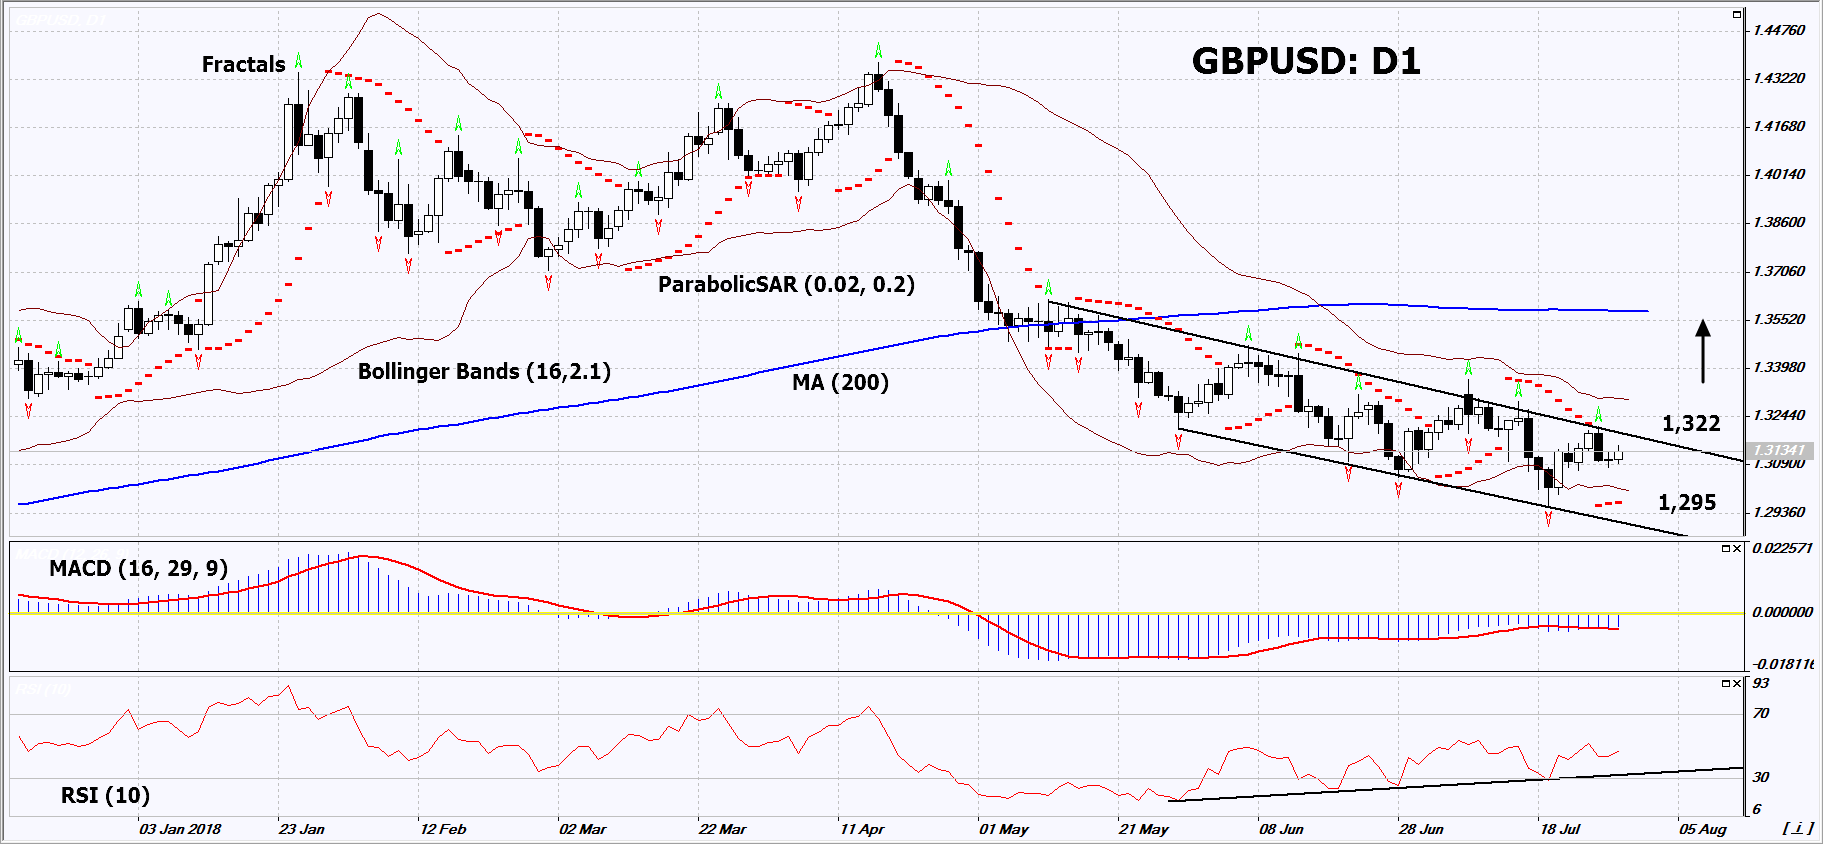
On the daily timeframe, GBPUSD: D1 approached the resistance line of the downtrend. It should be overcome before opening a buy position. A number of technical analysis indicators formed buy signals. The further price increase is possible in case of a rate hike by the Bank of England and its statements on the further tightening of the monetary policy.
- The Parabolic indicator gives a bullish signal.
- The Bollinger bands have narrowed, which indicates low volatility.
- The RSI indicator is below 50. It has formed a positive divergence.
- The MACD indicator gives a bullish signal.
The bullish momentum may develop in case GBPUSD exceeds its last fractal high and the resistance line of the downtrend at 1.322. This level may serve as an entry point. The initial stop loss may be placed below the last fractal low, the 10-month low, the lower Bollinger band and the Parabolic signal at 1.295. fter opening the pending order, we shall move the stop to the next fractal low following the Bollinger and Parabolic signals. Thus, we are changing the potential profit/loss to the breakeven point. More risk-averse traders may switch to the 4-hour chart after the trade and place there a stop loss moving it in the direction of the trade. If the price meets the stop level (1.295) without reaching the order (1.322), we recommend to close the position: the market sustains internal changes that were not taken into account.
Summary of technical analysis
| Position | Buy |
| Buy stop | Above 1.322 |
| Stop loss | Below 1.295 |
Market Analysis provided by IFCMarkets
Free Reports:
 Get Our Free Metatrader 4 Indicators - Put Our Free MetaTrader 4 Custom Indicators on your charts when you join our Weekly Newsletter
 Get our Weekly Commitment of Traders Reports - See where the biggest traders (Hedge Funds and Commercial Hedgers) are positioned in the futures markets on a weekly basis.