By IFCMarkets
G7 countries are concerned about the possible restriction of imports of their goods to the US
The G7 summit will be held on June 8 and 9, 2018 in Canada. Earlier, 6 countries from the “Big Seven” expressed concern about the increase in import duties in the US. Is there a possibility for the котировок euro to rise?
If the G7 countries act as a united front against recent US initiatives to raise import duties on goods from the EU and other countries, as well as anti-Iran sanctions, this could weaken the dollar. The EU authorities announced that they are going to take legal measures within the framework of the WTO regarding the restriction of the supply of European goods to the United States. In addition, European countries do not want to refuse to purchase oil from Iran despite US sanctions. Theoretically, disagreements between the “Big Seven” can have impact even on the Fed and slow the rate of the tightening of its monetary policy. An additional positive for the euro is the normalization of the political situation in Italy after the formation of a new government. According to preliminary data, inflation in the Eurozone in May rose to 1.9% in annual terms from 1.2% in April. This is more than expected. The growth in consumer prices increases the likelihood of the ECB rate hike. Now, most market participants believe that this can happen not earlier than next summer. Nevertheless, any assumptions about the tightening of the monetary policy can support the euro.
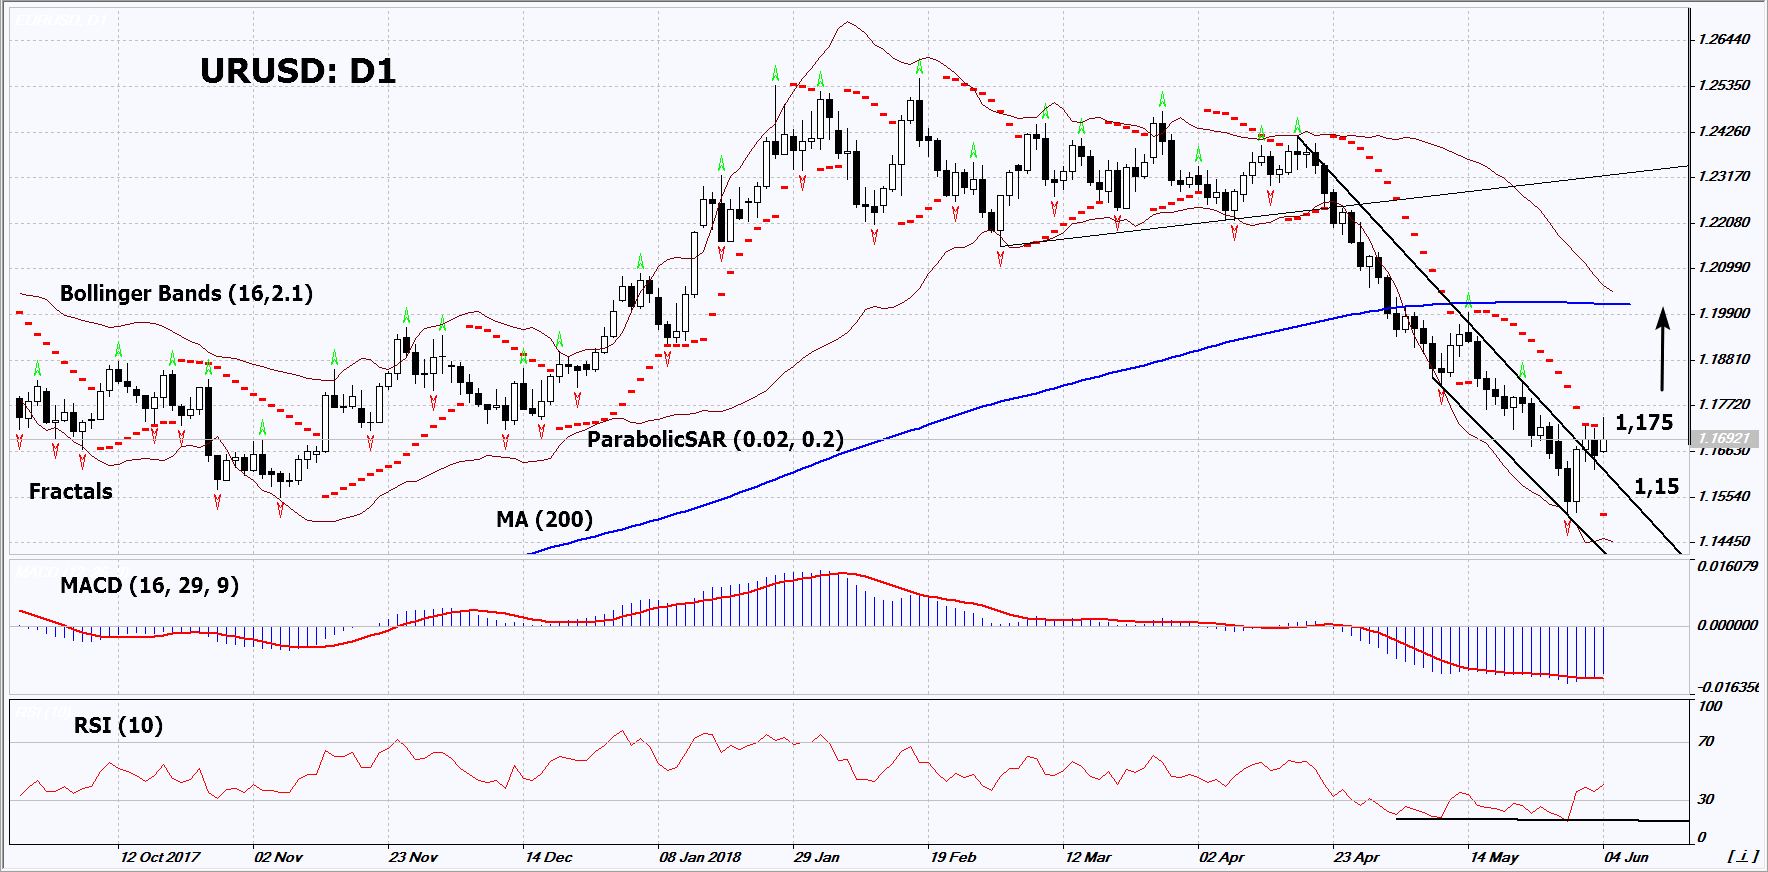
On the daily timeframe, EURUSD: D1 has exited the downtrend. The general downward direction is still preserved, but within its framework, an upward correction is quite possible. A price increase is possible in case of the negative reaction of the G7 countries to US plans to attach them to sanctions against Iran, as well as to limit the import of their goods to the United States. .
- The Parabolic indicator gives a bullish signal.
- The Bollinger bands have widened, which indicates high volatility.
- The RSI indicator is below 50. It has formed a weak, positive divergence.
- The MACD indicator gives a bullish signal.
The bullish momentum may develop in case EURUSD exceeds its last high at 1.175. This level may serve as an entry point. The initial stop loss may be placed below the last fractal low, the 11-month low and the Parabolic signal at 1.15. After opening the pending order, we shall move the stop to the next fractal low following the Bollinger and Parabolic signals. Thus, we are changing the potential profit/loss to the breakeven point. More risk-averse traders may switch to the 4-hour chart after the trade and place there a stop loss moving it in the direction of the trade. If the price meets the stop level at 1.15 without reaching the order at 1.175, we recommend to close the position: the market sustains internal changes that were not taken into account.
Summary of technical analysis
| Position | Buy |
| Buy stop | Above 1.175 |
| Stop loss | Below 1.15 |
Market Analysis provided by IFCMarkets
Free Reports:
 Get Our Free Metatrader 4 Indicators - Put Our Free MetaTrader 4 Custom Indicators on your charts when you join our Weekly Newsletter
 Get our Weekly Commitment of Traders Reports - See where the biggest traders (Hedge Funds and Commercial Hedgers) are positioned in the futures markets on a weekly basis.