Recently, an interesting concept was discussed among our research team – a very interesting concept about the markets. As many of you know, part of the process or research is to test conclusions that may lie outside common thinking. While we were discussing the Fibonacci and Elliot Wave structures of the US market using longer-term charts, one item kept intriguing our research team. This one item could change everything in terms of how we are thinking about the US markets and Global markets.
Almost everyone knows that Elliot Wave (EW) theory consists of Five Waves to complete a major EW Cycle. The most common form of EW price cycles is A, C & E (or 1, 3 & 5) waves advancing and B & D (or 2 & 4) waves declining for an uptrend.

Chart courtesy of stockcharts.com
The opposite is true for a downtrend. It is relatively common knowledge these types of price formations make up almost all of the markets price moves.

Chart courtesy of stockcharts.com
Free Reports:
 Get Our Free Metatrader 4 Indicators - Put Our Free MetaTrader 4 Custom Indicators on your charts when you join our Weekly Newsletter
 Get our Weekly Commitment of Traders Reports - See where the biggest traders (Hedge Funds and Commercial Hedgers) are positioned in the futures markets on a weekly basis.
Yes, there are variations that can sometimes come into play, like Triangle formations, Zig-Zag formations, Regular, Expanded, Contracting and other rarities. Yet, many people don’t understand the mathematics requirements that apply to EW and Fibonacci as a method of constructing proper EW structures.
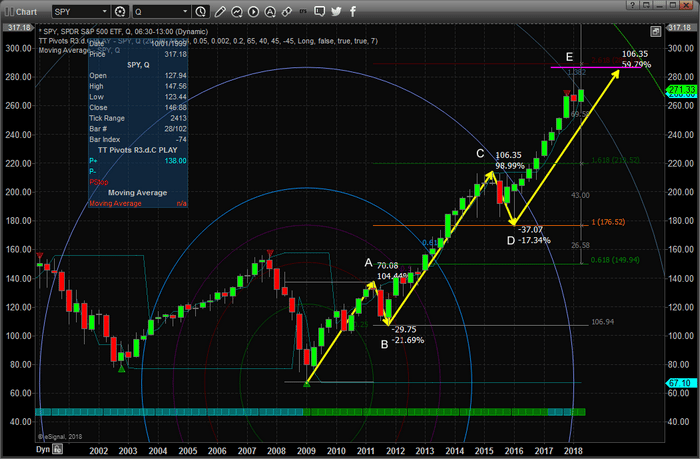
The question proposed by one of our research team was “what if this recent move higher (from 2011 to current) is nothing more than an extended wave 3 and not a wave 3-4-5 formation. What if this 166.94% rally in the SPY is nothing more than an extended Wave 3? This question began a quest within our team of research to try to identify if this concept had any validity – and the results are surprising.
BASIC CONCEPTS OF MAJOR AND MINOR WAVE FORMATIONS
Before we continue, allow us to explain some of the basic concepts of major and minor wave formations as defined by Ralph Nelson Elliot and Robert Prechter.
- The basic 8 wave form is fractal in nature. It is operating at all degrees (chart timeframes) simultaneously.
- In most impulses, there is a 5-wave pattern which unfolds adhering to the following rules:
- Subwave 2 does not overlap the start of wave 1
- Subwave 4 does not overlap the extreme of wave 1. Also, as a strong guideline, it is not advisable to assign a wave 4 label if there is any overlap of the territory of wave 1 during the 4th
- Subwave 3 is not the shortest of 1, 3, & 5.
- Impulses are typically bound by parallel lines
- In impulses, one of the waves 1, 3 or 5 will likely extend substantially in comparison to the other two. In the stock market, wave 3 is most likely to extend, whereas, in commodities, wave 5 is the more likely to extend.
- Rarely, a wedge-shaped diagonal appears as wave 1, A, 5 or C. It is sometimes referred to as a diagonal triangle. In a diagonal, both trendlines slope/tilt in the same direction (both up or both down). Most often, the trendlines converge (get closer together) as they extend. Sometimes they diverge (get further apart with time). Concepts courtesy of Elliott Wave Predictions
One aspect of the EW rules that intrigued us the most is that “Subwave 3 is not the shortest of 1, 3 & 5”. This facet of EW in combination with the concept that retracement waves typically contract to 38.2% of the previous impulse wave provided our research team with an impetus to consider alternative wave counts.
What if, this chart below, showing a completed EW 5 wave cycle where wave 3 & 5 are nearly identical in length is structurally incorrect.

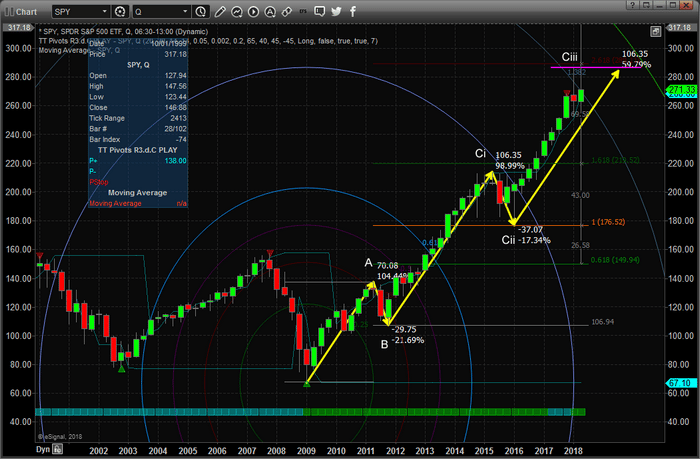
What if the real EW count is as we are showing in the next chart below – where the current upside wave (originating near the end of 2011) is nothing but an extended wave C setting up a push higher. Remember, wave 3 (in this case wave Ciii) can’t be the same length as wave Ci. In the chart, below, the yellow arrows drawn for Ci and Ciii are identical in length. It could be concluded that, if our hypothesis is correct, wave Ciii is not completed yet and will extend further to the upside (if it develops into a complete 5 wave structure) or wave Ciii may be near an end because it is already 2.618 x wave A and has completed a structurally relevant ABC formation. Traditionally, wave 3 is the longest wave of the ABCDE wave formation.
The one aspect of wave C in our research that confounds us is that neither of the corrective waves (wave Cii or the current pullback near wave Ciii) come close to the 0.382% pullback expected by corrective waves. This one component of our research is leading us to believe the upside in the US majors may be dramatically underestimated by most market analysts. If our research is correct, then this current market pullback, or corrective wave, may be a “combination sideways minor correction of wave C”.

Our predictive analysis is clearly indicating US majors should continue to push higher over the next few months. This analysis is counter to a completed EW 5 wave cycle. In other words, the US market should not attempt to target new highs if this recent high is the completion of a total EW 5 wave cycle. Therefore, it is our opinion that we are looking at an extended (2.618x) EW wave 3 move that will result in a correction at some point in the future (forming wave 4).

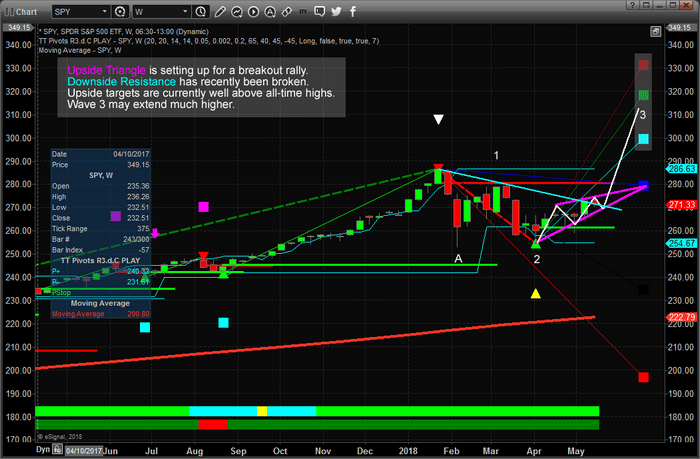
We will follow up this research article with another, more detailed, one soon. We believe we have accurately understood the EW pattern formations that are currently setting up in the market and we believe there is a strong potential for an upside breakout to attempt near all-time highs in the market before any start to a corrective wave. We believe far too many people have failed to understand the structure of this major EW pattern and have concluded this is an EW wave 5 completion. There are going to be a lot of short sellers getting caught in any upside move as the Upside Triangle breaks and prices push higher.
One condition for all of our analysis is that the low at corrective wave 2 (@ $254.67) must hold as price support. Failure for the price to hold above this level means we have a failure in our proposed analysis and we would fall back to a potential that this corrective move could fall further to complete a 0.382% (or greater) wave pattern. It all depends on price and our predictive modeling systems are showing us that price should advance over the next few weeks, thus we believe our analysis is correct.
As we close out this research post, think about what this means to us as traders. A large portion of the globe may be setting up for a massive market top formations – setting up short positions and leveraging their positions for what they believe could be a massive downside move. Yet, if our analysis is correct, this downside move may be over and we could be setting up for a broad upside move in the US markets to create a further extended wave C or a new wave E. If we are correct, the pressure put on these short sellers is going to be tremendous and the markets could skyrocket higher.
We’ve been discussing “capital migration” recently to highlight how fragile certain foreign and Emerging Markets are and how capital will quickly move into more stable economies/markets that can generate solid returns. It may be that we are setting up for a massive wave of capital migration into the US equities markets and the US Dollar that everyone is failing to understand or foresee. Time will tell if we are correct.
If you want to know how we are helping our members and the specialized proprietary research we offer to keep them ahead of this market, please visit www.TheTechnicalTraders.com. Last weeks trade resulted in a +18% profit for our members. Once you realize that we have been calling these market move perfectly over the past few months, you’ll understand that our membership costs are very nominal compared to the benefit and information we provide to you each day.
Our articles, Technical Trading Mastery book, and 3 Hour Trading Video Course are designed for both traders and investors to explore the tools and techniques that discretionary and algorithmic traders need to profit in today’s competitive markets. Created with the serious trader and investor in mind – whether beginner or professional – our approach will put you on the path to win. Understanding market structure, trend identification, cycle analysis, volatility, volume, when and when to trade, position management, and how to put it all together so that you have a winning edge.
Chris Vermeulen – TheTechnicalTraders.com