By Money Metals News Service
While official sources forecast U.S. Gross Domestic Product (GDP) to surpass $20 trillion this year, the real figure is probably much less. So how much less is real U.S. GDP? Well, that depends on how it is measured. If we factor in energy consumption and the increase in total public debt, U.S. GDP is likely less than half of the current figure.
Yes, it sounds insane to say that the current U.S. GDP is likely overstated by at least 50%, but if we go by fundamental data, it isn’t that crazy at all. Unfortunately, Americans have been conditioned to believe that money grows on trees and energy comes from the Wizard of Oz. Thus, if we need more money, then the U.S. Treasury can print more Federal Reserve Notes, or we can swipe the credit card. And, if we need electricity, we just switch on the light. Easy… Peasy.
Due to the highly complex nature of the world in which we live in today, the individual is clueless as to the tremendous amount of energy and work that it takes to produce the foods we eat and the goods, energy, and materials we consume. So, it should be no surprise that U.S. GDP can be overstated by 50%+.
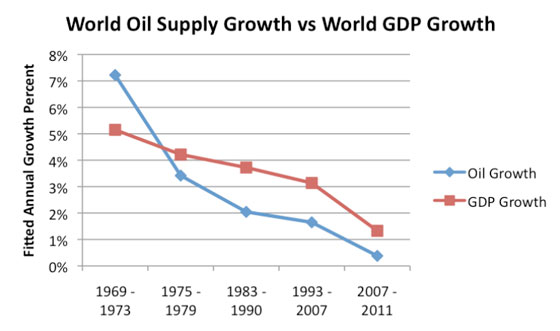
If we go by the data that shows the growth of Global GDP is related to the growth of Global Oil Supply, then it is very quite easy to spot inflated GDP figures. However, you have to be able to understand this essential ENERGY=GDP relationship. Of course, this is not taught in business or economic classes in high school or college. Instead, the economic teachers focus on the insane theory of SUPPLY vs. DEMAND. If individuals are taught GARBAGE, then their thinking and reasoning is GARBAGE. So, we really can’t blame them.
In looking at the following chart by Gail Tverberg, the increase in Global GDP corresponds to the rise in Global Oil Supply:
Free Reports:
 Get Our Free Metatrader 4 Indicators - Put Our Free MetaTrader 4 Custom Indicators on your charts when you join our Weekly Newsletter
 Get our Weekly Commitment of Traders Reports - See where the biggest traders (Hedge Funds and Commercial Hedgers) are positioned in the futures markets on a weekly basis.

As the annual growth percentage of World Oil Supply declined in the periods shown in the chart above, the same trend took place in World GDP. If we can understand the OIL-GDP relationship figures in the chart, then it is impossible for a country to grow its GDP if it does not increase its energy consumption.
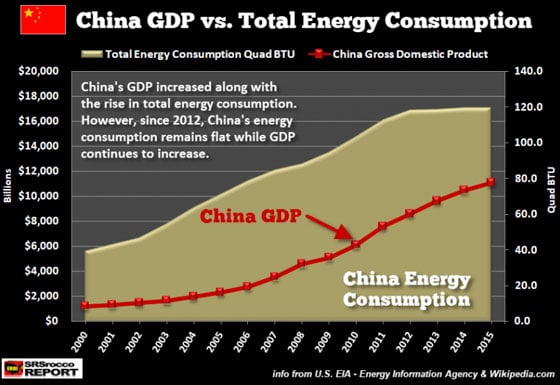
A perfect example of a country that increased both its energy consumption and GDP, is China. We can clearly see that as China’s total energy consumption increased from 2000 to 2011, so did its GDP:

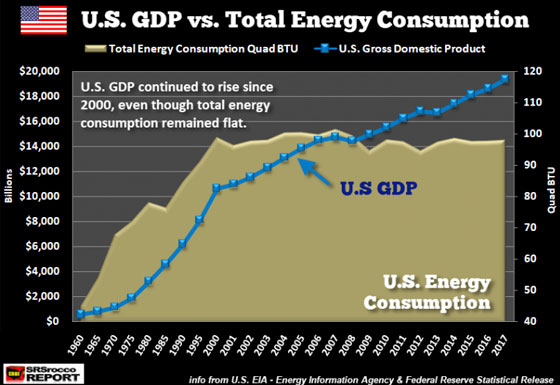
Furthermore, as China experienced double-digit annual increases in energy consumption between 2000-2008, its GDP also enjoyed double-digit growth. However, the same thing can’t be said for the United States as its GDP nearly doubled since 2000 while total domestic energy consumption remained flat:

In 2000, the U.S. consumed a total of 98.8 Quadrillion BTU’s (Quad BTU’s) of energy to produce $10.6 trillion in GDP. Amazingly, in 2017, the U.S. only burned 97.9 Quad BTU’s to generate $19.4 trillion in GDP. It seems as if the U.S. economy has figured out some magical way to consume less energy to produce nearly double the GDP.
Now, if we look at U.S. energy consumption from 1960 to 2000, we can clearly see that it increased along with the GDP. However, something changed after 2000 as U.S. GDP continued to grow while energy production remained flat or even declined. So, it seems as if the Energy Wizard of Oz stepped in and did his magic to produce GDP out of thin air.
It’s really quite hilarious to watch supposedly intelligent economists on CNBC and Bloomberg discuss rising U.S. GDP without factoring in energy consumption. Now, some individuals are going to claim that the U.S. economy has become more efficient with its energy consumption, so it was able to double its GDP. While this sounds like a plausible explanation, unfortunately, the EROI – Energy Returned On Investment of U.S. energy supply has been falling considerably since 2000. Which means, U.S. energy efficiency is going in the opposite direction… getting worse, not better.
Now that we understand that a country needs to consume more energy to grow its GDP, that’s only part of the story. It’s one thing to bamboozle individuals into believing GDP can increase while energy consumption remains flat, but another thing entirely to do so as public debt explodes.
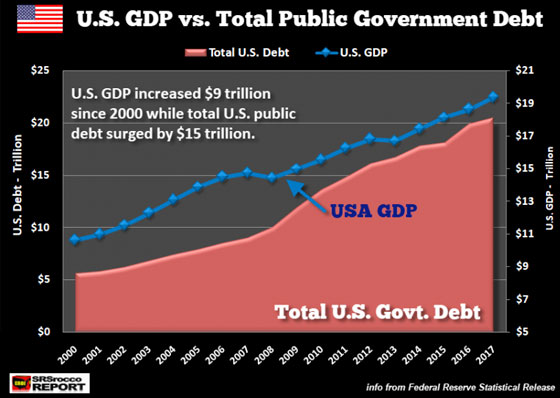
Since 2000, U.S. GDP has increased from $10.6 trillion to $19.3 trillion while total public debt skyrocketed by a staggering $15 trillion:

To put it another way, U.S. GDP increased by $9 trillion over the past seventeen years by adding $15 trillion worth of debt. Not a bad deal.. ah? So, not only has the Energy Wizard of Oz allowed U.S. GDP to grow while energy consumption remained flat but we must have had some help with the massive increase in debt by the Tooth Fairy.
As Americans continue to move blindly towards the coming ENERGY SENECA CLIFF, there’s going to be a real surprise when ILLUSIONS are replaced by REALITY.
Lastly, for all the professionals, individuals and bloggers who think they are really smart by claiming “This time in the stock market is different” or “Peak oil or the EROI don’t matter,” it’s time that you expand your knowledge and wisdom. If society has any chance of transitioning from the coming Energy and Economic Collapse, it will only do so if adults stop acting like children and grow up.
 The Money Metals News Service provides market news and crisp commentary for investors following the precious metals markets.