By IFCMarkets
US oil reserves increased for the first time in 11 weeks
According to the U.S. Energy Information Administration, US oil reserves increased by 6.8 mln barrels over the past week. This may indicate a reduction in demand. Will the WTI quotes drop?
The increase in the reserves occurred for the first time in 11 weeks. Market participants expected them to grow only by 100-120 thousand barrels. However, after the data publication, oil prices slightly increased, as the US gasoline reserves unexpectedly fell by 2 mln barrels, in contrast to their growth forecast of 1.8 mln barrels. Nevertheless, a possible future decline in oil quotes is indicated by an increase in the US oil production to 9.92 mln barrels per day in a week and the forecasts for further growth to 11 mln barrels per day by 2019. In particular, ExxonMobil announced that it intends to triple the production to 600 thousand barrels per day in seven years at the Permian oil basin in Texas. High oil prices contributed to an increase in the US active rigs count by 12 in the last week. This is the highest increase since March 2017. The next data on the active rigs count will come out on Friday. They are expected to increase further.
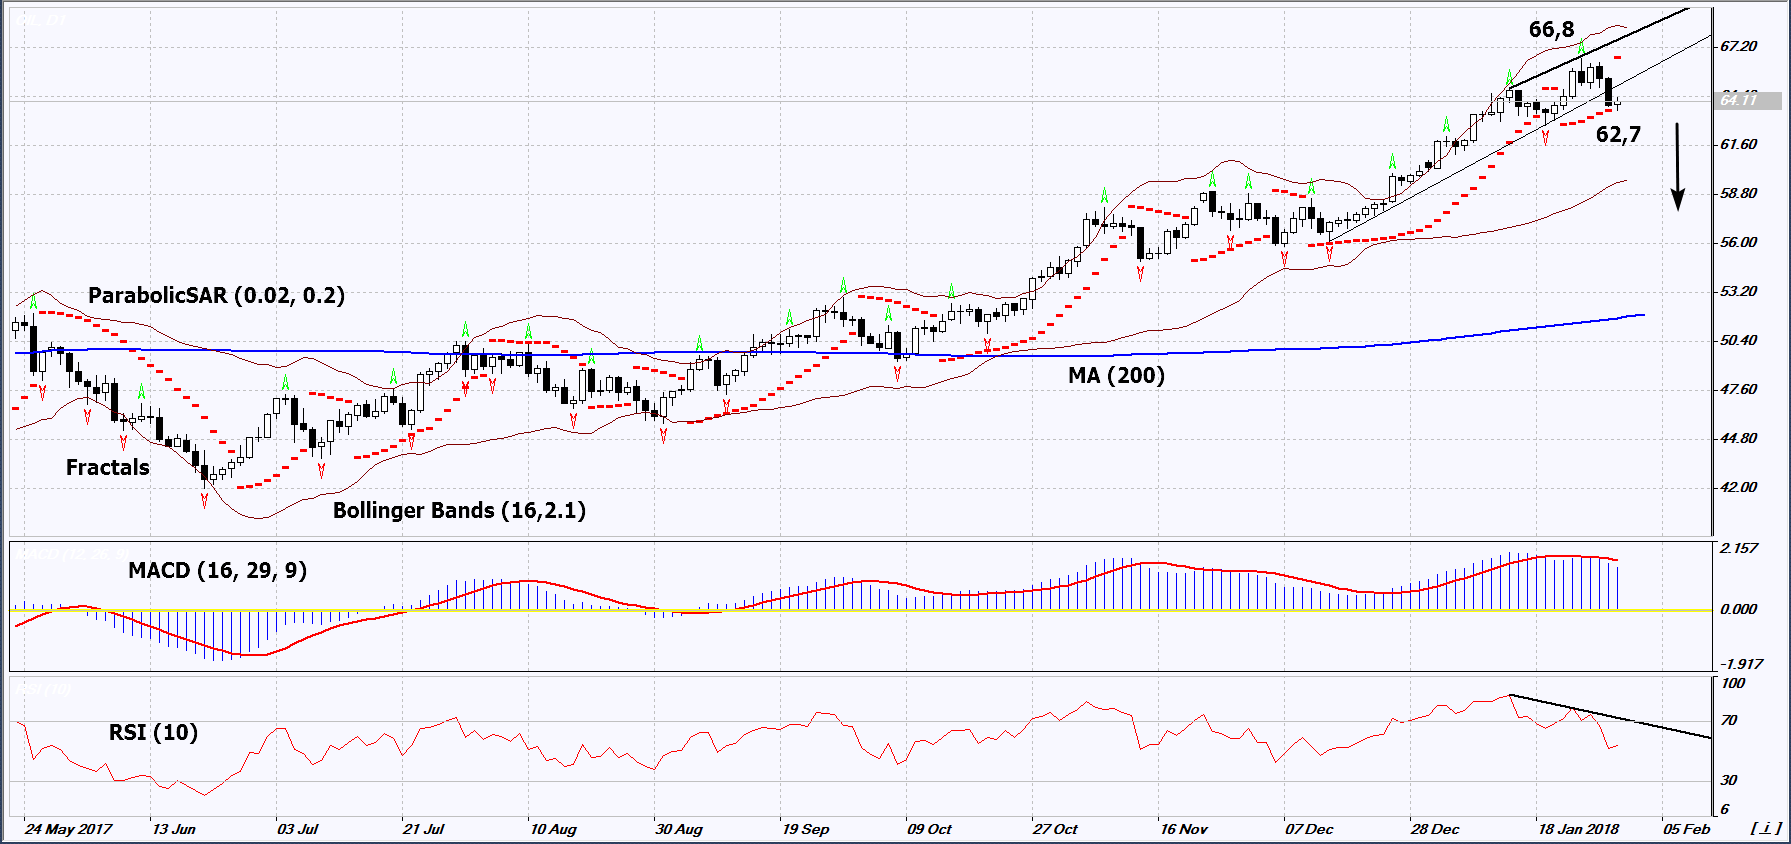
On the daily timeframe, OIL: D1 remains in the long-term rising trend, but its growth has slowed down and some technical analysis indicators formed Sell signals. A downward correction is possible in case of the further production increase in the US and a reduction in demand, confirmed by an increase in the reserves.
- The Parabolic indicator gives a bearish signal.
- The Bollinger bands have widened, which means higher volatility.
- The RSI indicator is above 50. It has formed a negative divergence.
- The MACD indicator gives a bearish signal.
The bearish momentum may develop in case OIL drops below its last fractal low at 62.7. This level may serve as an entry point. The initial stop loss may be placed above the last fractal high, the 3-year high and the Parabolic signal at 66.8. After opening the pending order, we shall move the stop to the next fractal high following the Bollinger and Parabolic signals. Thus, we are changing the potential profit/loss to the breakeven point. More risk-averse traders may switch to the 4-hour chart after the trade and place there a stop loss moving it in the direction of the trade. If the price meets the stop level at 66.8 without reaching the order at 62.7, we recommend cancelling the position: the market sustains internal changes that were not taken into account.
Summary of technical analysis
| Position | Sell |
| Sell stop | below 62,7 |
| Stop loss | above 66,8 |
Market Analysis provided by IFCMarkets
Free Reports:
 Get Our Free Metatrader 4 Indicators - Put Our Free MetaTrader 4 Custom Indicators on your charts when you join our Weekly Newsletter
 Get our Weekly Commitment of Traders Reports - See where the biggest traders (Hedge Funds and Commercial Hedgers) are positioned in the futures markets on a weekly basis.