Article By RoboForex.com
AUD USD, “Australian Dollar vs US Dollar”
The AUD/USD pair is trading at 0.8066; the instrument is still moving above Ichimoku Cloud, which means that it may continue growing. We should expect the price to test Tenkan-Sen and Kijun-Sen at 0.8030 and then continue moving upwards to reach 0.8225. Another signal to confirm further ascending movement is the price’s rebounding from the support level. However, the scenario that Implies further growth may be cancelled if the price breaks the downside border of the cloud and fixes below 0.7965. In this case, the pair may continue falling towards 0.7860.

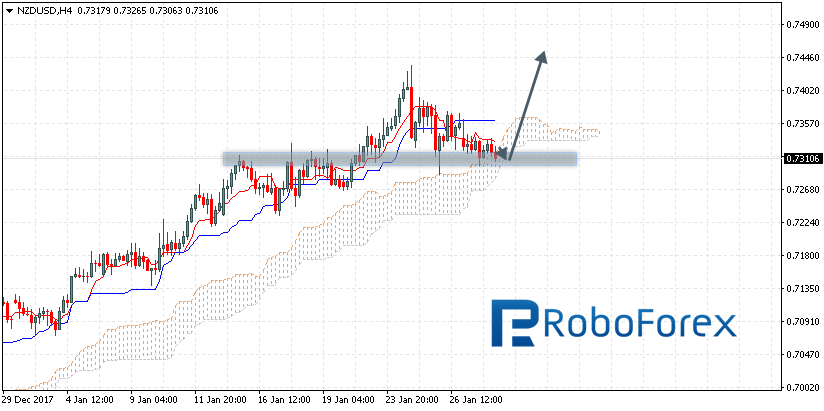
NZD USD, “New Zealand Dollar vs US Dollar”
The NZD/USD pair is trading at 0.7310; the instrument is still moving inside Ichimoku Cloud, which means that it is moving sideways. We should expect the price to test the downside border of the cloud at 0.7305 and then continue moving upwards to reach 0.7445. Another signal to confirm further ascending movement is the price’s rebounding from the support level. However, the scenario that implies further growth may be cancelled if the price breaks the downside border of the cloud and fixes below 0.7260. In this case, the pair may continue falling towards 0.7155. After breaking 0.7360, the pair may resume growing.
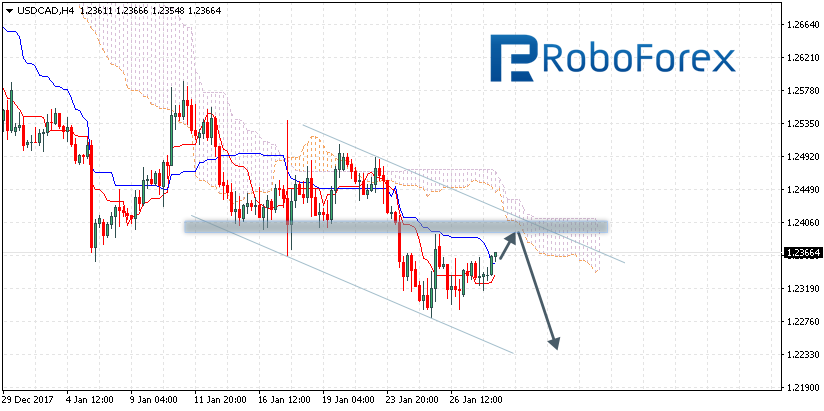
USD CAD, “US Dollar vs Canadian Dollar”
Free Reports:
 Get Our Free Metatrader 4 Indicators - Put Our Free MetaTrader 4 Custom Indicators on your charts when you join our Weekly Newsletter
 Get our Weekly Commitment of Traders Reports - See where the biggest traders (Hedge Funds and Commercial Hedgers) are positioned in the futures markets on a weekly basis.
The USD/CAD pair is trading at 1.2366; the instrument is still moving below Ichimoku Cloud, which means that it may continue falling. We should expect the price to test the downside border of the cloud at 1.2385 and then continue moving downwards to reach 1.2245. Another signal to confirm further descending movement is the price’s rebounding from the resistance level. However, the scenario that implies further decline may be cancelled if the price breaks the upside border of the Triangle pattern and fixes above 1.2455. In this case, the pair may continue growing towards 1.2650.
RoboForex Analytical Department
Article By RoboForex.com
Attention!
Forecasts presented in this section only reflect the author’s private opinion and should not be considered as guidance for trading. RoboForex LP bears no responsibility for trading results based on trading recommendations described in these analytical reviews.