By IFCMarkets
Drought may damage the wheat crop
Drought in Australia and the Republic of South Africa may significantly reduce the cereal crops. Will the wheat prices increase?
Australia is a major producer and 4th wheat exporter in the world after the US, Canada and Russia. Because of the drought, the yield of this crop may decrease to 1.72 tonnes per hectare in the 2017/18 season in Australia. This is the lowest for the last 8 seasons and by 36% less than 2.7 tonnes per hectare in the 2016/17 season. According to forecasts, the wheat crop in Australia in the 2017/18 season may reach 20.15 mln tonnes, which is by 40% lower than the historically maximum harvest in the previous season of 35.56 mln tonnes. Domestic wheat consumption in Australia is estimated at 7-8 mln tonnes, and the reserves – at 6-7 mln tonnes. The wheat export from Australia in the 2017/18 season may amount to about 17 mln tonnes. The Minister of Finance of South Africa Malusi Gigaba said that the wheat harvest in his country will be reduced by 10% because of the drought. South Africa is a major grain importer and may increase the wheat purchases in the world market. The Ministry of Agriculture of India will increase the wheat purchase price from the fresh crop from local farmers by 6.8% to $ 26.66 per centner. The redeemed grain will replenish the Indian state reserves. Recall, that earlier the wheat quotes updated the 2-month low on the background of the USDA forecast about the essential growth of the world reserves in the 2017/18 season.
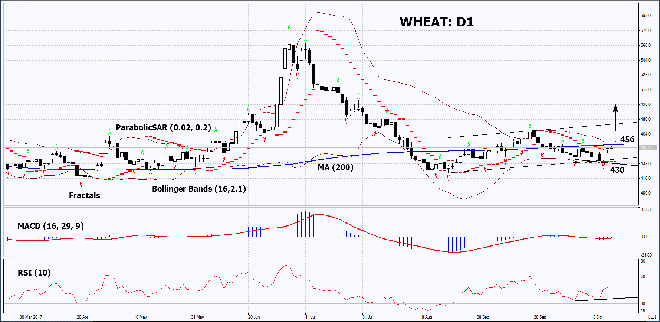
On the daily timeframe, WHEAT: D1 is in the rising channel. Further price increase is possible in case of preserving high global demand and the decrease of crop in major producer countries.
- The Parabolic indicator gives a bullish signal.
- The Bollinger bands have narrowed, which means lower volatility. They are tilted upwards.
- The RSI indicator exceeded 50. It has formed a positive divergence.
- The MACD indicator gives a bullish signal.
The bullish momentum may develop in case WHEAT exceeds the 200-day moving average line, the last fractal high and the upper Bollinger band at 456. This level may serve as an entry point. The initial stop loss may be placed below the Parabolic signal, the lower Bollinger band, the 2-month low and last fractal low at 430. After opening the pending order, we shall move the stop to the next fractal low following the Bollinger and Parabolic signals. Thus, we are changing the potential profit/loss to the breakeven point. More risk-averse traders may switch to the 4-hour chart after the trade and place there a stop loss moving it in the direction of the trade. If the price meets the stop level at 430 without reaching the order at 456, we recommend cancelling the position: the market sustains internal changes that were not taken into account.
Free Reports:
 Get Our Free Metatrader 4 Indicators - Put Our Free MetaTrader 4 Custom Indicators on your charts when you join our Weekly Newsletter
 Get our Weekly Commitment of Traders Reports - See where the biggest traders (Hedge Funds and Commercial Hedgers) are positioned in the futures markets on a weekly basis.
Summary of technical analysis
| Position | Buy |
| Buy stop | above 456 |
| Stop loss | below 430 |
Market Analysis provided by IFCMarkets