Article By RoboForex.com
EUR USD, “Euro vs US Dollar”
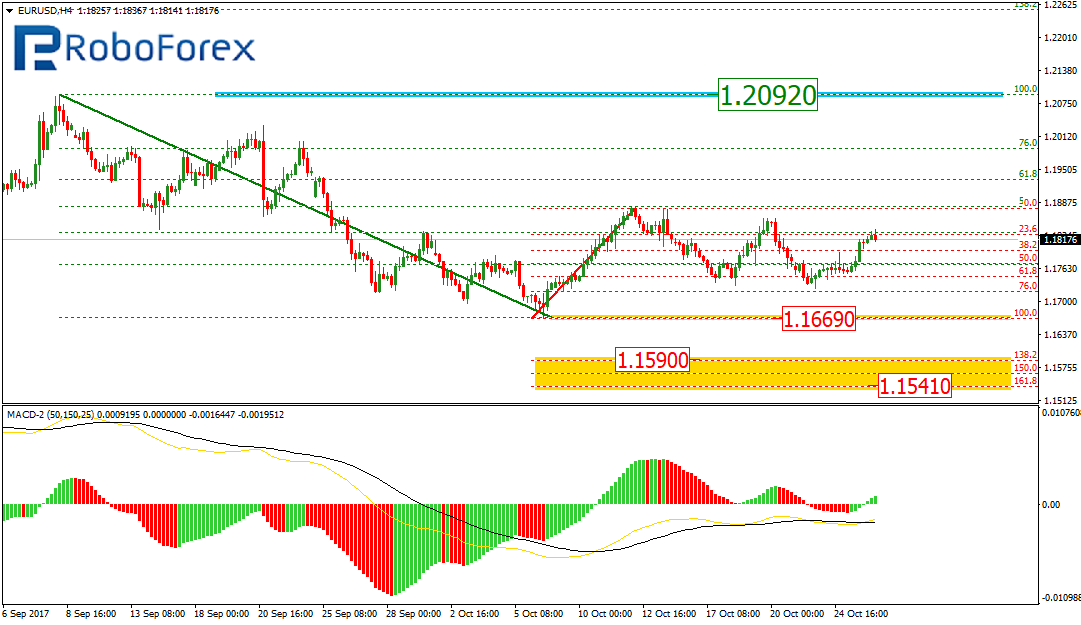
As we can see at the H4 chart, the EUR/USD pair is still being corrected. In the nearest future, the price is expected to break the local low at 1.1669 and move towards the post-correctional extension area between the retracements of 138.2% and 161.8% at 1.1590 and 1.1541 respectively.
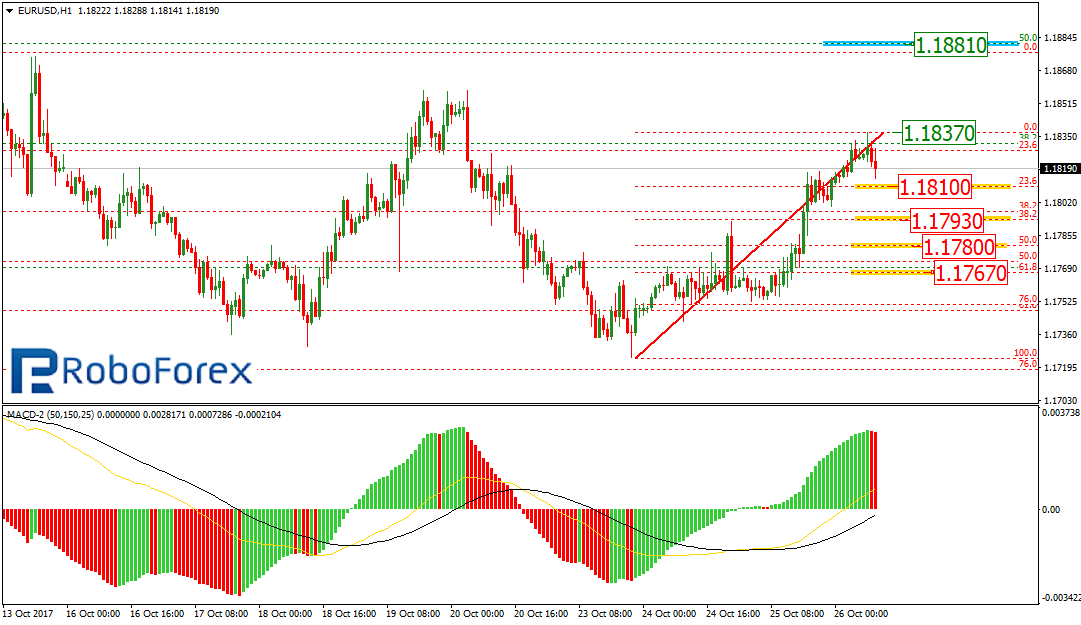
At the H1 chart, the EUR/USD pair may fall towards the retracements of 23.6%, 38.2%, 50.0%, and 61.8% at 1.1810, 1.1793, 1.1780, and 1.1767 respectively. However, if the price breaks the high at 1.1837, it may grow to reach 1.1881.
USD JPY, “US Dollar vs. Japanese Yen”
As we can see at the H4 chart, after breaking the high, the USD/JPY pair has reached the post-correctional extension area between the retracements of 138.2% and 161.8% at 114.10 and 115.53 respectively. The next upside target may be the retracement of 261.8% 116.30. The support level is at 111.650.
Free Reports:
 Get Our Free Metatrader 4 Indicators - Put Our Free MetaTrader 4 Custom Indicators on your charts when you join our Weekly Newsletter
 Get our Weekly Commitment of Traders Reports - See where the biggest traders (Hedge Funds and Commercial Hedgers) are positioned in the futures markets on a weekly basis.

At the H1 chart, the pair started a new correction, which has already reached the retracement of 23.6%. The next targets of the correction may be the retracements of 38.2%, 50.0%, and 61.8% at 113.25, 112.94, and 112.64 respectively.

RoboForex Analytical Department
Article By RoboForex.com
Attention!
Forecasts presented in this section only reflect the author’s private opinion and should not be considered as guidance for trading. RoboForex LP bears no responsibility for trading results based on trading recommendations described in these analytical reviews.