Article By RoboForex.com
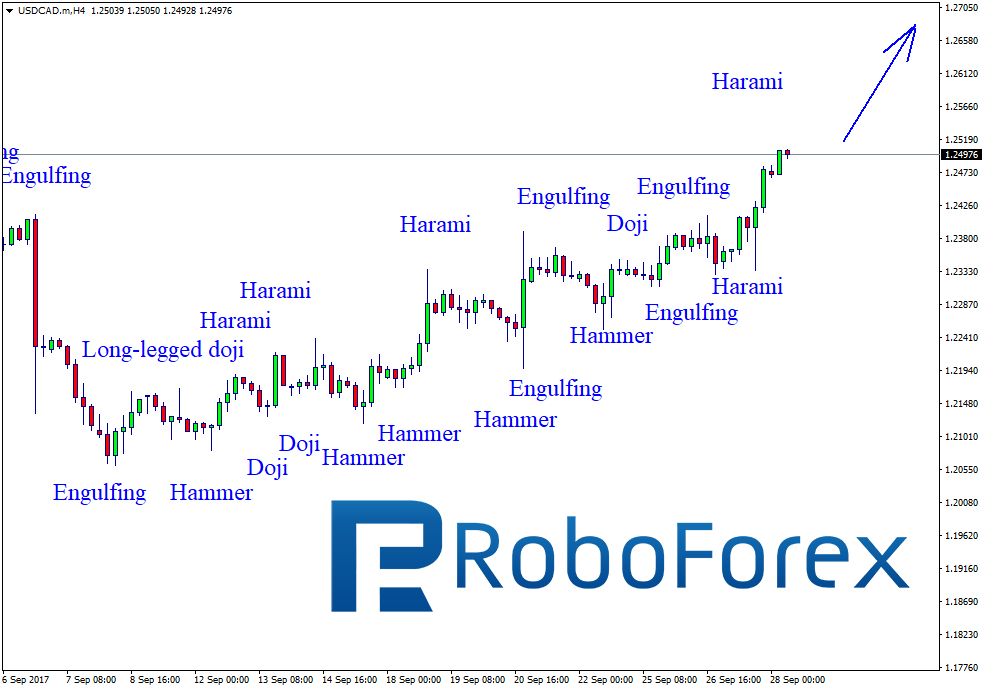
USD CAD, “US Dollar vs Canadian Dollar”
At the H4 chart, the USD/CAD pair continues growing and forming the ascending channel with Long-Legged Doji, Hammer, Doji, Harami, and Engulfing reversal patterns at support and resistance levels to define its borders. After finishing another pullback and forming Engulfing pattern, the price reached the resistance level at 1.2455 and broke it. Then the instrument formed Harami pattern and continued growing. The upside target is the next resistance level at 1.2621.
XAU USD, “Gold vs US Dollar”
As we can see at the H4 chart, the instrument continues forming the descending channel with Gap, Engulfing, Shooting Star, Doji, Hammer, and Inverted Hammer patterns to define its borders. The price reached the support level, broke it, paused for a while, and then continued falling to reach the next support level at 1271.00.

RoboForex Analytical Department
Free Reports:
 Get Our Free Metatrader 4 Indicators - Put Our Free MetaTrader 4 Custom Indicators on your charts when you join our Weekly Newsletter
 Get our Weekly Commitment of Traders Reports - See where the biggest traders (Hedge Funds and Commercial Hedgers) are positioned in the futures markets on a weekly basis.
Article By RoboForex.com
Attention!
Forecasts presented in this section only reflect the author’s private opinion and should not be considered as guidance for trading. RoboForex LP bears no responsibility for trading results based on trading recommendations described in these analytical reviews.