By The Gold Report
Source: Clive Maund for Streetwise Reports 09/11/2017
Technical analyst Clive Maund charts the relationship between gold and the U.S. dollar.
Gold continues to build towards its breakout from a massive 4-year long
base pattern. This is likely to occur when the dollar breaks down from
its topping pattern, and is expected to lead to a bull market that will
dwarf the last one from 2001 through 2011, and may be given a tailwind
when the cryptocurrency Ponzi scheme implodes. In some quarters gold is
being described as having broken out already, as are gold stocks, but
they haven’t yet, as we will see, and we will also look at evidence that
points to the probability of a short- to medium-term dollar bounce and a
pullback in the precious metals sector before the big breakout occurs.
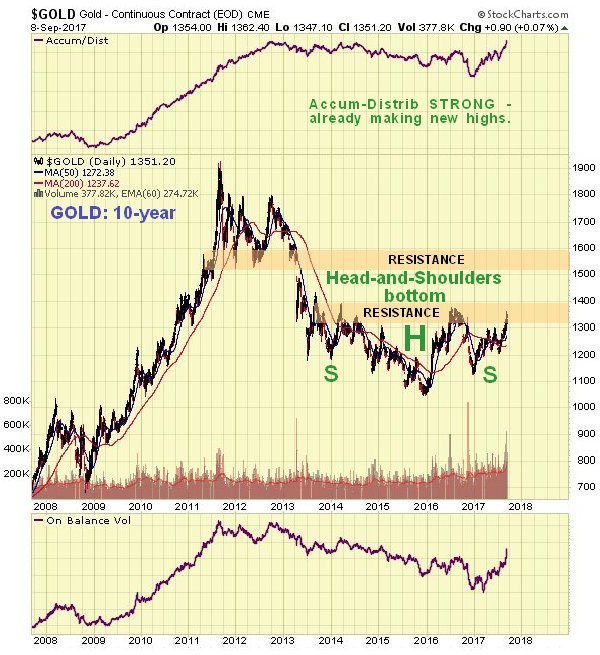
On gold’s 10-year chart we can see its fine giant 4-year long
Head-and-Shoulders bottom approaching completion, with the price rising
up in recent weeks to the broad band of quite strong resistance at the
top of the pattern, partly due to tensions over North Korea. These are
expected to ease, which will make a short-term correction back more
likely. Before leaving this chart note the volume build on the rally out
of the Right Shoulder low of the pattern, and the strength of the
volume indicators shown, especially the Accum-Distrib line, which rather
amazingly is already at new highs. This certainly bodes well for the
longer-term outlook.
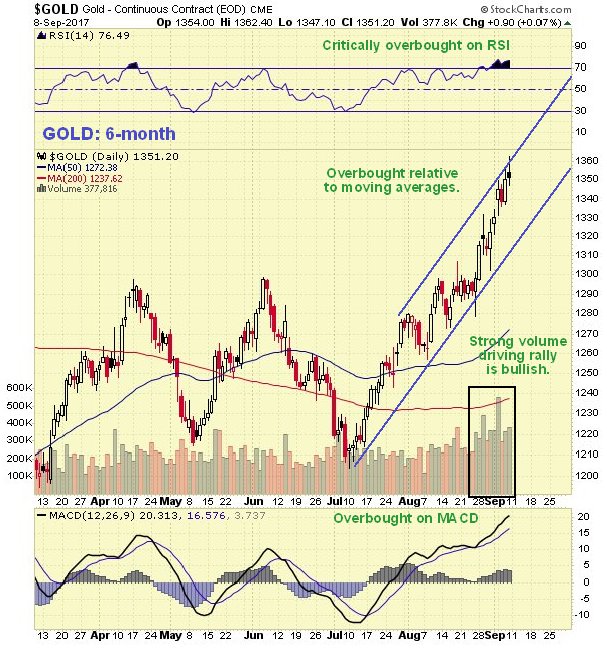
probability of a reaction back is high. On the 6-month chart we can see
that last week the price rose up to the top of its uptrend channel where
a prominent “spinning top” candlestick formed on Friday, with the RSI
indicator critically overbought, making it likely that gold will react
back at least to the lower boundary of this channel. The overbought MACD
and sizeable gap with the moving averages also increase the risk of a
reaction.
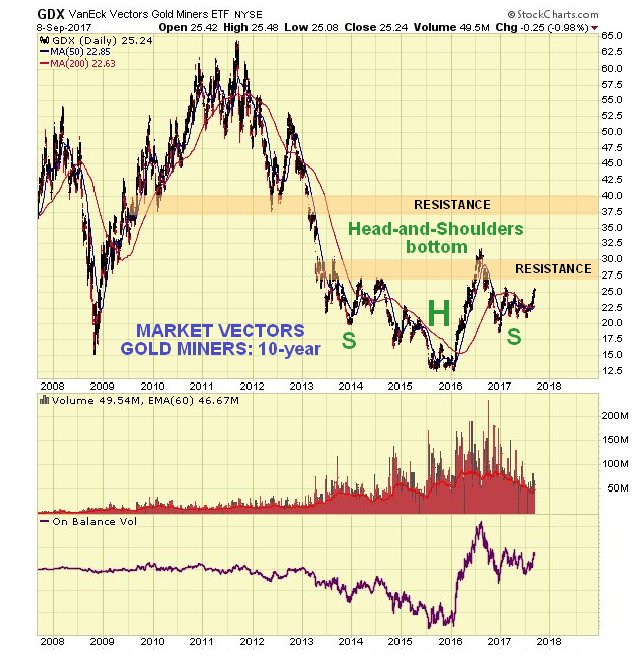
4-year long Head-and-Shoulders bottom. They are still quite a way from
having broken out, as we can see on the 10-year chart for GDX shown
below, and vulnerable to a near-term reaction on a dollar rebound, that
should not see them lose much ground. The big volume on the rally during
the first half of last year showed that the bottom was in and that a
major new bull market is in prospect. The formation of the Right Shoulder
of this H&S bottom served to correct this strong advance.
A big reason for gold to react back again soon would a rebound by the
dollar, which is made more likely by the fact that a lot of commentators
are reading it its “last rites”it’s not that they are wrong, it’s
just that there are a lot of people of one side of the boat now, so they
may prove to be wrong short-term but right longer-term.
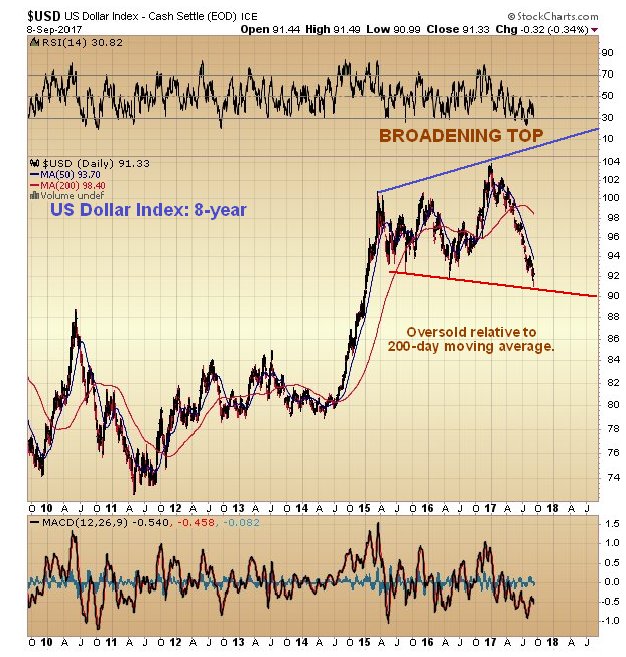
We will now look at some of the big reasons that the dollar could rally
soon. On the 8-year chart for the dollar index we can immediately see
one of themthe dollar has now arrived at the lower boundary of a
large Broadening Top pattern in an oversold state, and while it is
believed to be destined to break down from this pattern in due course,
it looks likely that it will bounce of its lower boundary over the
short to medium-term to correct the oversold condition before going on
to break down later.
Free Reports:
 Get Our Free Metatrader 4 Indicators - Put Our Free MetaTrader 4 Custom Indicators on your charts when you join our Weekly Newsletter
 Get our Weekly Commitment of Traders Reports - See where the biggest traders (Hedge Funds and Commercial Hedgers) are positioned in the futures markets on a weekly basis.
short-term is the latest dollar Hedgers chart, which is now quite
strongly bullish. On this chart we see that large Commercial Hedgers,
who are almost always right, have cashed in nearly all of their net
short positions for a nice fat profit, so that they are now at a very
low level, and they would be unlikely to do this if the dollar was set
to drop much further. On this chart we also have the benefit of seeing
what happened to the dollar soon after they did this on earlier
occasions. As we can see it usually rose.
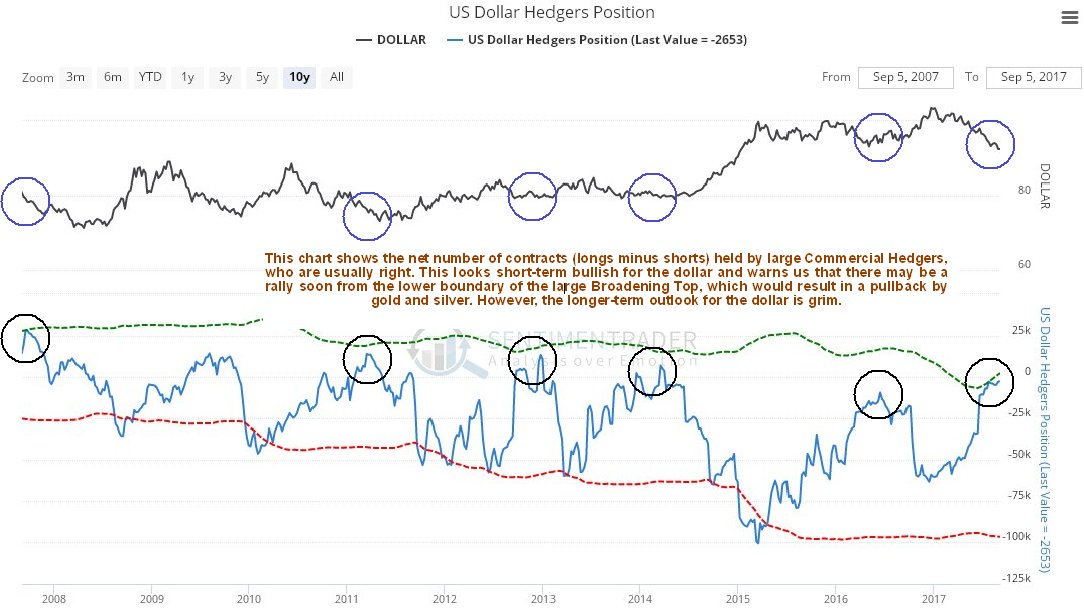
Chart courtesy of www.sentimentrader.com
Those who think that the dollar will plunge because Nicolas Maduro of Venezuela has announced that his beleaguered country will stop selling in oil in dollars
are likely to be disappointed. President Maduro would be well advised
to look up what happened to Saddam Hussein after he proposed doing the
same, and we must assume that either he doesnt know his history, or is
tired of being president of a failed state and is contriving a way to be
forcibly removed from office.
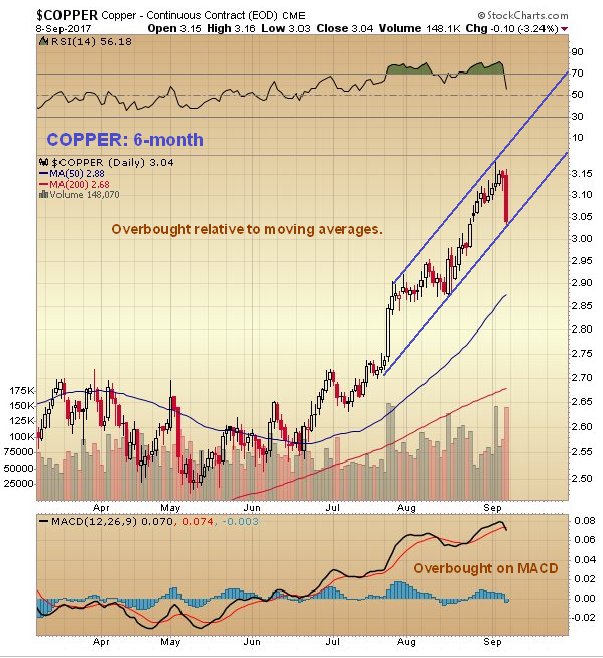
We have seen how copper, known as Dr. Copper because it tends to lead the
economy and lead the metals, has been in the vanguard of the recent
metals rally. Thus it is interesting to observe on its 6-month chart
below how it suddenly dropped hard on Friday having become overbought,
which is thought to presage a dollar rebound and a near-term drop by
other metals, like gold and silver.
looking destined to break out from a giant 4-year long base pattern to
enter a bull market that promises to dwarf the last one, as the dollar
collapses and China (and possibly Russia and other countries) backs its
currency with gold, and the cryptocurrency Ponzi scheme implodes, with
the liberated funds (or what’s left of them) flowing into gold and
silver. Cryptos got a shock late last week when China reportedly revealed that it was set to close local exchanges.
From China’s standpoint cryptos are a needless risk to its citizen’s
capital, and represent potential competition for its future
gold-backed yuan, albeit not for any intelligent person, and are a
nuisance that it can deal with simply by banning them, which as a
Command Economy that can ignore criticism, it has the power to do.
Near-term gold is looking set to react back as the dollar bounces off
support with tensions over North Korea easing as the U.S. has no choice but to
accept that North Korea has graduated to the nuclear club, even if it
cannot be described as one of its august members.
Clive Maund has been president of www.clivemaund.com, a successful resource sector website, since its inception in 2003. He has 30 years’ experience in technical analysis and has worked for banks, commodity brokers and stockbrokers in the City of London. He holds a Diploma in Technical Analysis from the UK Society of Technical Analysts.
Want to read more Gold Report articles like this? Sign up at www.streetwisereports.com/get-news for our free e-newsletter, and you’ll learn when new articles have been published. To see recent articles with industry analysts and commentators, visit our Streetwise Interviews page.
Disclosure:
1) Statements and opinions expressed are the opinions of Clive Maund and not of Streetwise Reports or its officers. Clive Maund is wholly responsible for the validity of the statements. Streetwise Reports was not involved in the content preparation. Clive Maund was not paid by Streetwise Reports LLC for this article. Streetwise Reports was not paid by the author to publish or syndicate this article.
2) This article does not constitute investment advice. Each reader is encouraged to consult with his or her individual financial professional and any action a reader takes as a result of information presented here is his or her own responsibility. By opening this page, each reader accepts and agrees to Streetwise Reports’ terms of use and full legal disclaimer. This article is not a solicitation for investment. Streetwise Reports does not render general or specific investment advice and the information on Streetwise Reports should not be considered a recommendation to buy or sell any security. Streetwise Reports does not endorse or recommend the business, products, services or securities of any company mentioned on Streetwise Reports.
Charts provided by the author.


![]()