By IFCMarkets
Expecting the Fed meeting and the speech of the ECB head
This Wednesday, September 20, 2017, the next US Fed meeting will take place. Rates are not expected to grow, but the dollar may strengthen in case of positive statements by the US regulator. Is there a possibility for the EURUSD rate to reduce?
The Fed may announce a possible rate increase at its next meetings this year: on November 1 or December 13. The Fed may also report a reduction in the volume of bonds on its balance sheet, which currently amounts to $ 4.5 trillion. Such announcements may strengthen the dollar. On Thursday and Friday, September 21-22, 2017, the ECB head Mario Draghi will speak. If he does not again announce plans to reverse the monetary stimulating policy, this could have a negative impact on the euro exchange rate. Let us recall that last week, the member of the ECB Board of Directors Benoit Coeure said that in order to increase inflation in the eurozone to the target level of 2%, it is necessary to continue pursuing soft monetary policy. This stopped the euro growth. Note that according to the CFTC, the volume of net short positions for US dollars increased for the 4th consecutive week and reached the 4.5-year high. Their possible closure may provide an additional support for the US currency.
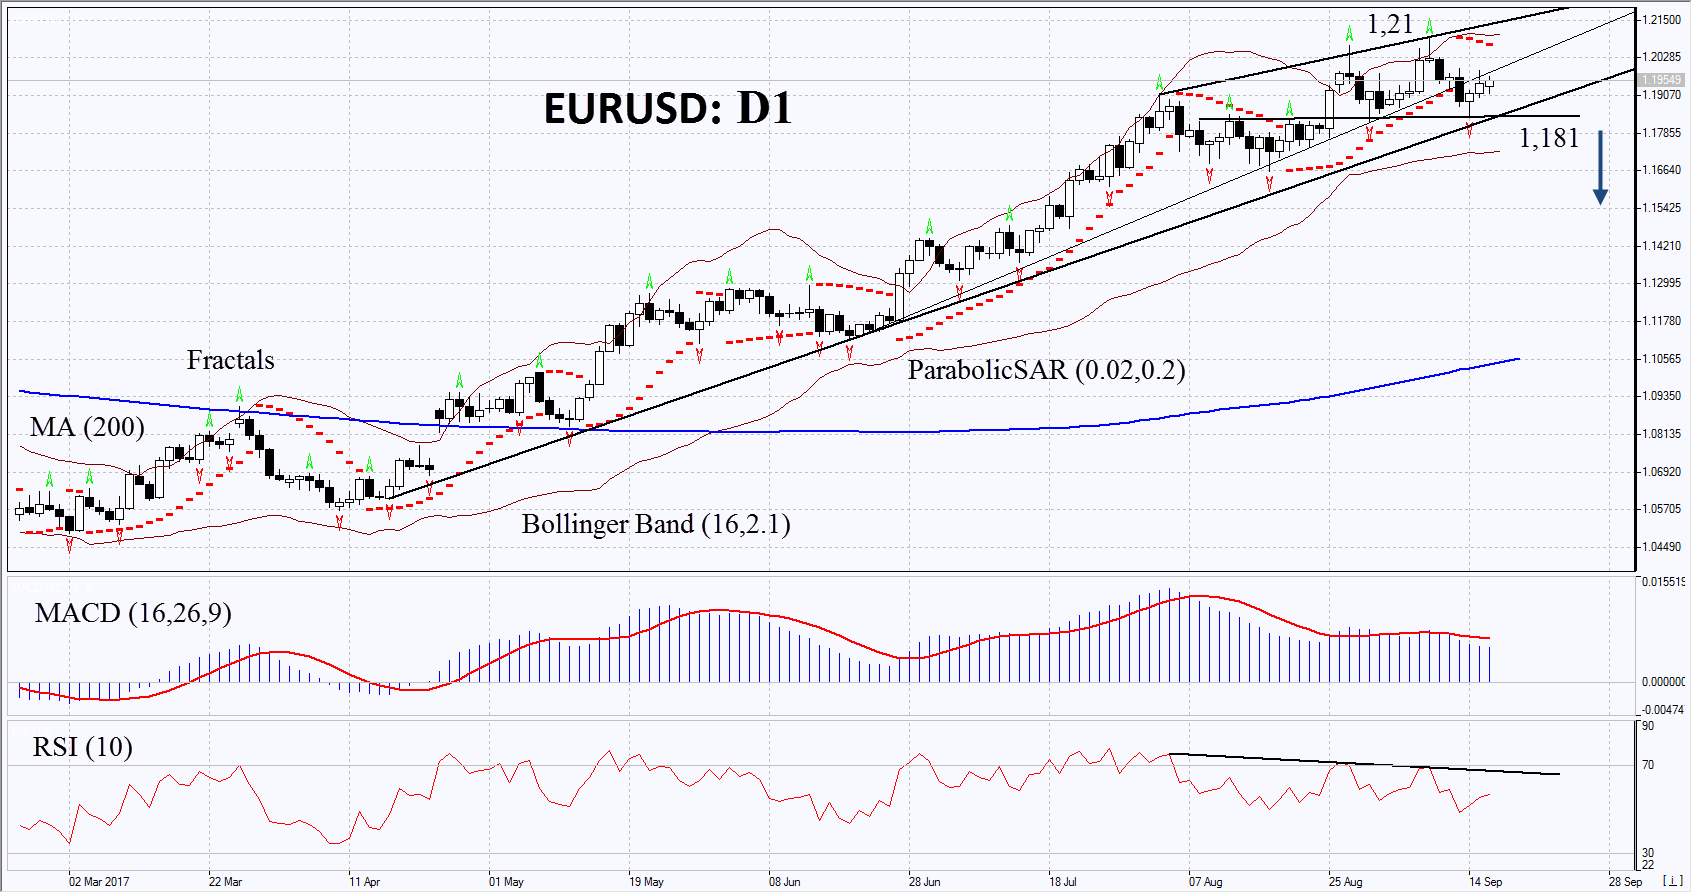
On the daily timeframe, EURUSD: D1 came out from the rising trend to neutral. Moreover, a number of indicators formed bearish signals. Downward correction is possible in case the Fed has plans to hike the rate this year, as well as in case the ECB refrains from increasing its rate in the nearest future.
- The Parabolic indicator gives a bearish signal.
- The Bollinger bands have narrowed, which means lower volatility.
- The RSI indicator is above 50. It has formed a negative divergence.
- The MACD indicator gives a bearish signal.
The bearish momentum may develop in case EURUSD drops below the two last fractal lows at 1.181. This level may serve as an entry point. The initial stop loss may be placed above the last fractal high, the 3.5-year high, the upper Bollinger band and the Parabolic signal at 1.21. After opening the pending order, we shall move the stop to the next fractal high following the Bollinger and Parabolic signals. Thus, we are changing the potential profit/loss to the breakeven point. More risk-averse traders may switch to the 4-hour chart after the trade and place there a stop loss moving it in the direction of the trade. If the price meets the stop level at 1.21 without reaching the order at 1.181 we recommend cancelling the position: the market sustains internal changes that were not taken into account.
Free Reports:
 Get Our Free Metatrader 4 Indicators - Put Our Free MetaTrader 4 Custom Indicators on your charts when you join our Weekly Newsletter
 Get our Weekly Commitment of Traders Reports - See where the biggest traders (Hedge Funds and Commercial Hedgers) are positioned in the futures markets on a weekly basis.
Summary of technical analysis
| Position | Sell |
| Sell stop | below 1,181 |
| Stop loss | above 1,21 |
Market Analysis provided by IFCMarkets