By Orbex Blog
Daily Forex Market Preview, 06/09/2017
The US dollar continued to suffer as latest threats from North Korea sparked heightened tensions in the region. Investors continued to shun the risk assets bidding up the safe haven assets.
On the economic front, the RBA held interest rates steady as expected in yesterday’s meeting. Data from the US showed that factory orders fell 3.3% as forecast by economists. In the UK, the services PMI weakened to 53.2, missing forecasts but the British pound managed to post gains on the day.
Looking ahead, the Bank of Canada’s interest rate decision is due later today. No changes are expected from the BoC, but the central bank could potentially signal another rate hike at the October meeting. Therefore, the comments from Governor Poloz will be important. In the US, the ISM’s non-manufacturing PMI will also be coming out today. Forecasts expect a pick in the non-manufacturing activity in August.
EURUSD intraday analysis

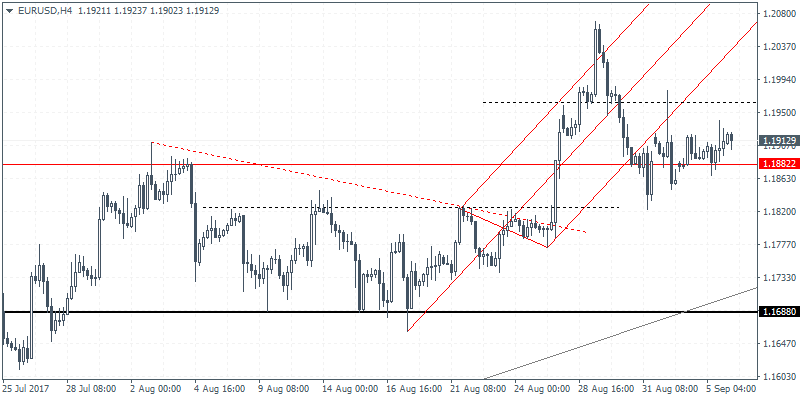
EURUSD (1.1912): The euro currency was seen trading subdued with price action trading with Friday’s range. However, the common currency was seen attempting to post higher close in the past few days as it nears the 1.1963 resistance level. On the 4-hour chart, the short term bias remains to the upside with price supported above 1.1882. A reversal at the short-term resistance level at 1.1963 could potentially signal a move to the downside. EURUSD could remain trading within the range into tomorrow’s ECB meeting with further gains or declines based on the market interpretation of the ECB meeting and press conference. Still, the bias remains for a correction to 1.1688. However, this could change should EURUSD manage to close above 1.1963 resistance.
GBPUSD intraday analysis

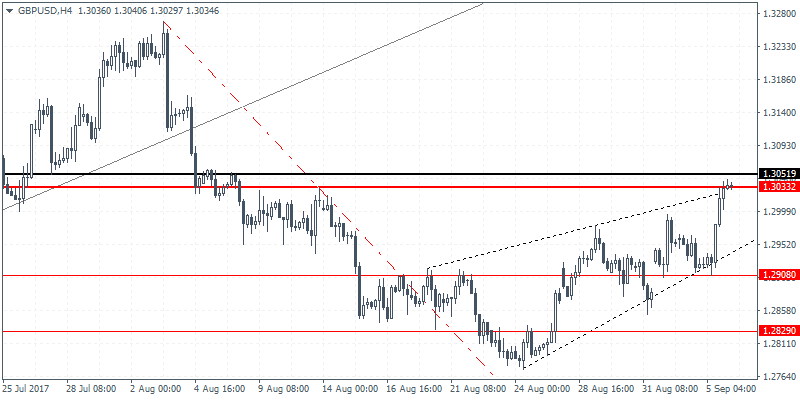
GBPUSD (1.3034): The British pound posted strong gains yesterday as the price reached 1.3033 resistance. A reversal off this level is essential for the potential head and shoulders pattern to be validated. Therefore a daily close below 1.3033 could signal an initial move to the downside towards the neckline support at 1.2847 followed by a move to 1.2628 which completes the measured move of the head and shoulders pattern to the downside. Watch for any potential reversal candlestick pattern on the 4-hour chart near the resistance level. A break out above 1.3051 could, however, signal further gains towards 1.3116.
USDJPY intra-day analysis

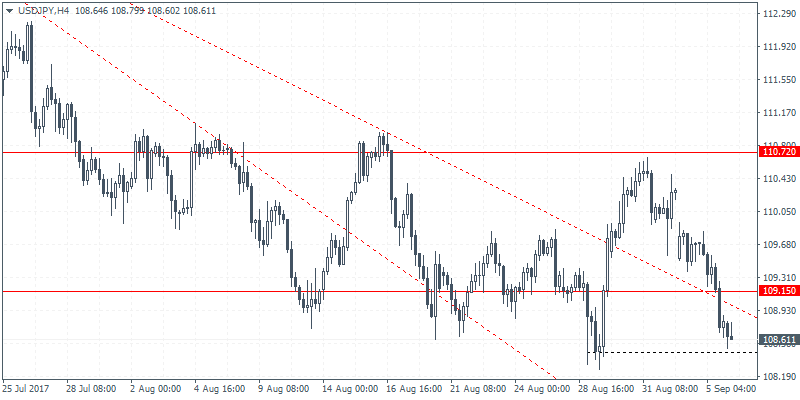
USDJPY (108.61): The USDJPY turned bearish yesterday as price action closed below 109.15. The declines could now see the US dollar slip towards the lower end of the support at 108.26. On the daily chart, this also increases the downside risk as the price is trading in this support level. With the descending triangle pattern being formed, a breakdown below 108.26 support could spell further declines.
However, there is scope for USDJPY to form a double bottom pattern near 108.46 which falls with the daily chart’s support zone. A reversal off this level cannot be ruled out, however, which could build the upside bias. The previously established support level at 109.15 will likely serve as resistance in the near term with further gains coming on a breakout above this level only.