By Admiral Markets

Dear traders,
Patterns offer information about expected price movement. Some call it the path of least resistance. Patterns simply don’t dictate to the markets. Human emotions and behaviour shape the markets. Traders want to make profits. When traders make profits, it usually instills a feeling of greed. When price turns against traders, traders becomes anxious, anxiety brings fear, fear causes panic, then big players step-in, collecting profits from naive newbie traders, and then the whole process starts again…
There are dozens of patterns out there, today I’ll focus on the market behavioural patterns that you should never forget. According to the path of least resistance, these patterns are connected to human behaviour.
- Chart patterns are connected to market psychology
- Wave patterns are connected to market psychology
- Candlestick patterns are connected to bounce, breakout and market psychology
- Trend line patterns are connected to bounce and breakout
- Fibonacci ratios are connected to entry and exit
- Fractal and time patterns are connected to entry and exit
- Divergence patterns are connected to end of trend / momentum.
Candlestick Patterns
Order Blocks

Source: EUR/JPY H1 chart, Admiral Markets platform Oct-Nov 2016
By definition, a bullish order block is the height of the bearish candle prior to it moving up. Conversely, a bearish order block is the low of a bullish candle prior to moving down. I personally extended the definition by classifying order blocks by their bullish or bearish wicks. Price action tends to respect the wicks by subsequently testing them after they have been established. This is connected to market psychology. Now moment buyers or sellers usually join at the re-test of order blocks.
Free Reports:
 Get Our Free Metatrader 4 Indicators - Put Our Free MetaTrader 4 Custom Indicators on your charts when you join our Weekly Newsletter
 Get our Weekly Commitment of Traders Reports - See where the biggest traders (Hedge Funds and Commercial Hedgers) are positioned in the futures markets on a weekly basis.
High Wave

Source: AUD/USD H1 chart, Admiral Markets platform, Dec 2016
This pattern was originally developed by Steve Nison in his “Candlestick Course”. A high wave candlestick pattern is a series of small doji candles that are making a u-turn at the top or a bottom. This is a strong reversal confirmation and one of my favourites for trading countertrend setups. This pattern precedes breakouts.
Pinbar
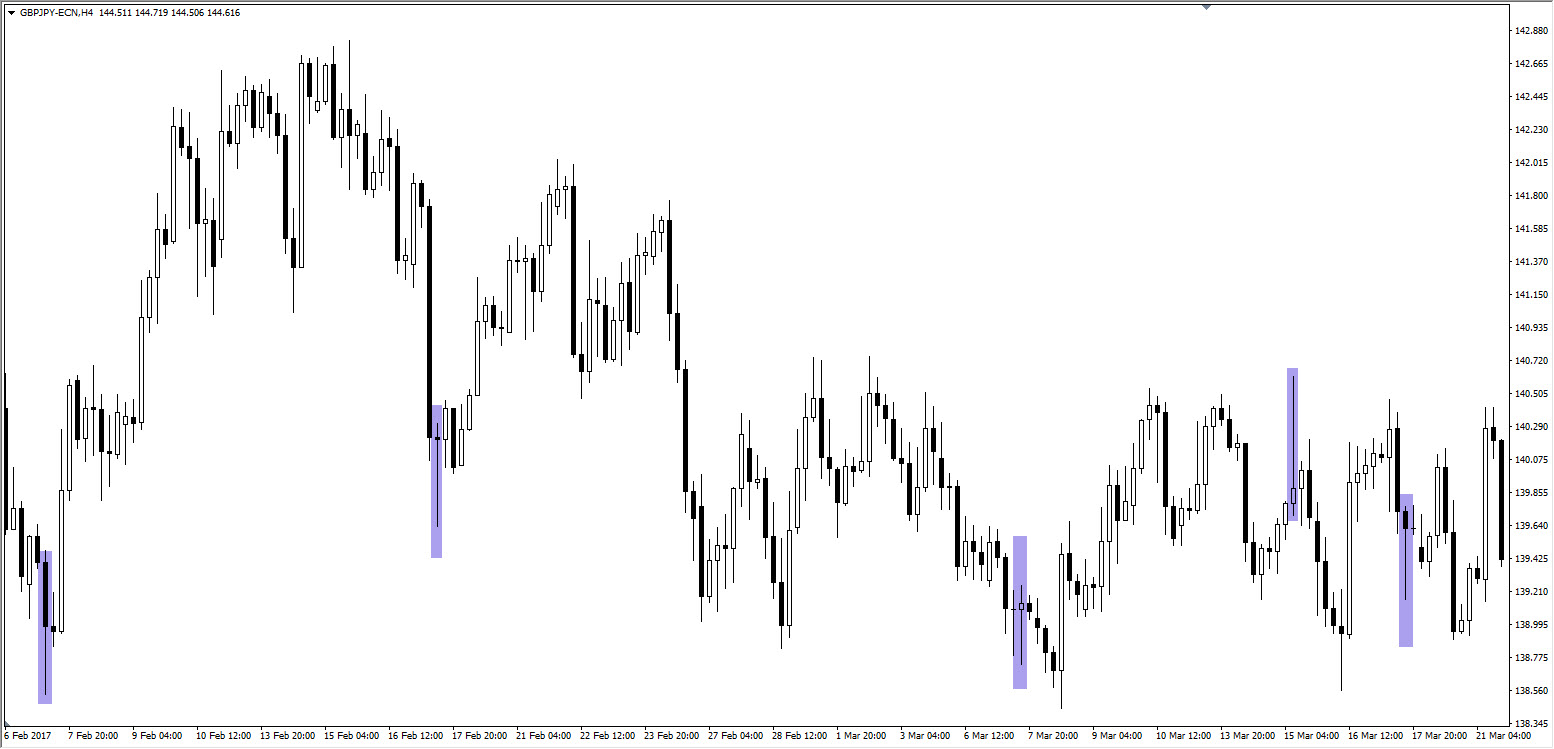
Source: GBP/JPY H4 chart, Admiral Markets platform, Feb-Mar 2017
A pinbar is a major reversal candle. A pinbar is identified if:
- the open and the close are within the previous candle;
- the candle wick is roughly three times the length of the candle body;
- there’s a long nose protruding from all other candles.
The psychology behind the pinbar candle is that the price has “lied” to us. It tried to convince us it was moving in an “obvious” direction but, in reality, price moved in completely the opposite way. For that reason, sometimes the pinbar is called a “Pinnochio”.
Wave Pattern

Source: EUR/USD 1h chart by Elite CurrenSea, Aug 2017, Admiral Markets platform
If we connect the wave, chart and divergence patterns with trend line patterns identified on a single chart, we might draw some conclusions.
Wave Patterns: the EUR/USD wave analysis indicated that a wave 5 of 5 of a larger wave 3 was probably completed. The next retracement would most likely become a large and choppy wave 4 and occur via an ABC correction. This is connected to market psychology and profit taking.
Chart Patterns: the EUR/USD broke the rising wedge chart pattern which is a bearish reversal signal (purple lines). The bearish break also occurred on a NFP (Non-Farm Payroll) day with large momentum propelling price. This is connected to market bias, as big traders joined with huge volumes. All weaker stops are collected and price moves very fast reacting to news data.
Trend Line Patterns: Price is now building a new bullish corrective chart pattern (green lines). A break below the support trend lines should indicate a bearish breakout and the start of bearish continuation. This is connected to bounce and breakouts.
Divergence Patterns: Price was showing divergence between the tops and indicating a likely retracement. Divergence is connected to momentum change.
Fibonacci Ratios

Source: AUD/USD Daily chart,Oct 2011- Feb 2012, Admiral Markets platform
According to my and Chris’ trading experience, the best target for Forex and financial trading is the -61.8% Fib, but the strongest reversal patterns, based on the Fibonacci sequence, usually happen at 78.6 and 88.6 ratio. The 78.6% or 0.786 is the square root of 0.618 while the 88.6% or 0.886 is the square root of 0.7864. Those ratios are established as strong and deep reversal levels. Their connection is traced back to the 61.8% golden ratio, but also to big market players who prefer to buy lower and sell higher. 78.6% and 88.6% are strong entry points. Bounces from 78.6% and 88.6% can be spotted in every time frame and, in Forex trading, they are very common.
Fractals

Source: AUD/USD H1 chart, Aug 2017, Admiral Markets platform
Fractal trading is connected to breakouts. By applying fractals, traders can easily connect them into channels and trend lines. A Fractal is one of five indicators of Bill Williams’ trading system, which allow traders to detect the bottom or the top. A technical definition of the upwards fractal is a series of at least five successive bars, with the highest high in the middle, and two lower highs on both sides.
These were behavioural patterns that traders should memorise as they have a connection between trading psychology and trading decisions. To find out more, please feel free to visit my educational webinars and enjoy my live trading setups.
Cheers and safe trading,
Nenad

Article by Admiral Markets
Source: Market Behavioural Patterns That You Should Never Forget

Admiral Markets is a leading online provider, offering trading with Forex and CFDs on stocks, indices, precious metals and energy.