Article By RoboForex.com
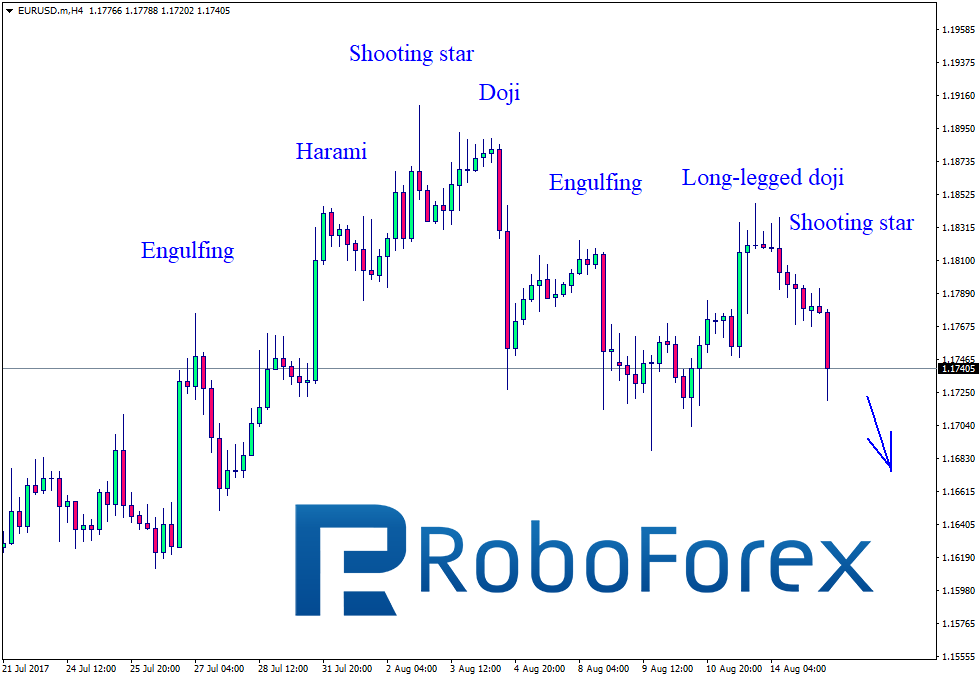
EUR/USD, “Euro vs. US Dollar”
At the H4 chart of EUR USD, the price is moving sideways, but Shooting Star, Doji, Engulfing, and Long-Legged Doji patterns indicate that the uptrend may reverse to the downside and the pair may start falling. After breaking the support level, the price may continue falling to reach the downside target at 1.1625.
NZD/USD, “New Zealand Dollar vs US Dollar”
At the H4 chart of NZD USD, we can see Engulfing patterns, which are regularly formed at the tops of correction. The patterns indicate that the downtrend continues. After finishing another correction, the price completed Engulfing and Long-Legged Doji patterns to show that the pair may break the support level and fall towards 0.7222.

RoboForex Analytical Department
Free Reports:
 Get Our Free Metatrader 4 Indicators - Put Our Free MetaTrader 4 Custom Indicators on your charts when you join our Weekly Newsletter
 Get our Weekly Commitment of Traders Reports - See where the biggest traders (Hedge Funds and Commercial Hedgers) are positioned in the futures markets on a weekly basis.
Article By RoboForex.com
Attention!
Forecasts presented in this section only reflect the author’s private opinion and should not be considered as guidance for trading. RoboForex LP bears no responsibility for trading results based on trading recommendations described in these analytical reviews.