U.S. Gold Exports Surge As Gold Trade Deficit Continues
By Money Metals News Service
It’s no secret that the East (Asians and Indians) continue to acquire a lot of gold as Western demand has weakened this year. According to the most recent data released by the USGS – United States Geological Survey, U.S. gold exports surged during the first four months of the 2017 versus the same period last year.
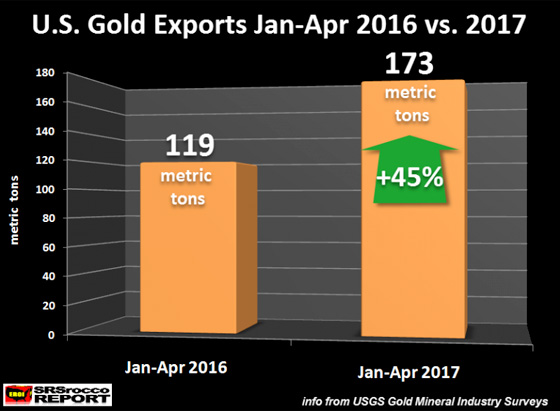
How much? A great deal. In the first four months of 2017, the U.S. exported a stunning 173 metric tons of gold (5.5 million oz) compared to 119 metric tons (3.8 million oz) during the same period last year. Thus, U.S. gold exports Jan-Apr 2017 surged 45% versus last year:


This is quite a large increase. I would imagine part of the increase is due to the fact that U.S. precious metals retail demand is off considerably ever since Trump was elected President. U.S. Gold Eagle sales are down a whopping 62% 1H 2017 versus the same period last year.
For example, the U.S. Mint sold 501,000 oz of Gold Eagles during the first half of 2016, versus 192,000 oz for the first half of 2017. This is a drop of 309,000 oz.
That being said, the drop off in physical gold investment demand in the U.S. has been offset by elevated demand in the East. As I mentioned in a previous article, the U.S. exported 31.4 metric tons to Hong Kong alone in January. Thus, Hong Kong received more than half (57%) of all U.S. gold exports during January this year.
Free Reports:


So, what were the top five countries that received the majority of the 173 metric tons of U.S. gold exports?
Top 5 U.S. Gold Exports JAN-APR 2017 (mt =metric tons)
Hong Kong = 66.7 mt (38%)
Switzerland = 48.3 mt (28%)
U.K. = 25.5 mt (15%)
India = 22.9 mt (13%)
U.A.E = 6.1 mt (4%)
Of the 173 mt of U.S. gold exports, these five countries received 169.5 mt, or 98% of the total. Hong Kong and India received 51%, while Switzerland and the U.K received 43% of the total. However, much of the gold that is exported to Switzerland and the U.K. make its way to China, India or other Asian countries. So, it is safe to assume that the majority of U.S. gold exports are eventually making their way to the East.
What is also quite interesting is that the U.S. continues to export more gold than it produces and imports. During Jan-Apr 2017, the U.S. produced 77 mt of gold, while it imported 88 mt, for a total of 165 mt. However, total U.S. gold exports for the first four months of the year equaled 173 mt, or 8 mt more than it produced and imported.
Thus, the U.S. continues to run a GOLD TRADE DEFICIT.
While precious metals investors in the West are frustrated by the low gold price (and the failure to break above $1,300), the East doesn’t seem to mind a bit. The Eastern philosophy for owning gold is to acquire it on price dips for the longer term, while the West tends to become frustrated over the shorter term.
So, I don’t look at the 62% decline in U.S. Gold Eagle sales Jan-Apr versus last year, as a bad thing. Rather, I just brush it off as the West‘s FICKLE investment nature.