By Admiral Markets

Dear Traders,
Many traders make all of their trading decisions on one single time frame. Other traders have stopped using multiple time frames after failing to implement the concept.
By the end of this article, however, you will know why and how I use
multiple time frame (MTF) analysis to improve and optimise my discretionary trading decisions.
My analysis always takes into account three time frames. I will show you exactly how each time frame
benefits my trading plan.
Learn the best time frames
Which three time frames do I recommend?
Free Reports:
 Get Our Free Metatrader 4 Indicators - Put Our Free MetaTrader 4 Custom Indicators on your charts when you join our Weekly Newsletter
 Get our Weekly Commitment of Traders Reports - See where the biggest traders (Hedge Funds and Commercial Hedgers) are positioned in the futures markets on a weekly basis.
The answer is surprisingly simple:
all of them.
Do keep in mind that the time frames have sufficient distance from each other. I do not consider using a 1, 2 and 3 minute charts as multiple time frame (MTF) analysis because the time frames are way too close to each other.
If you are using
MetaTrader 4 or MT4 Supreme Edition, then you will always choose relevant three time frames with sufficient distance.
Personally, I tend to use these time frames combinations:
- Swing trading: weekly, daily, 4 hour charts.
- Intra-day/week trading: daily, 4 hour, 1 hour charts.
- Intra-day trading: daily, 1 hour, 15 minute charts.
Long-term traders could use a monthly, weekly and daily (or 4 hour) chart combination. Scalpers could perhaps go with a 1 hour, 15 minute and 5 minute chart combination.
The bad news is, using multiple frame analysis requires both more attention and time from you than single time analysis.
The good news is, there are methods to
quickly perform MTF analysis (multi time frame) by using specially indicators like the Mini Charts from MT4 Supreme Edition package.
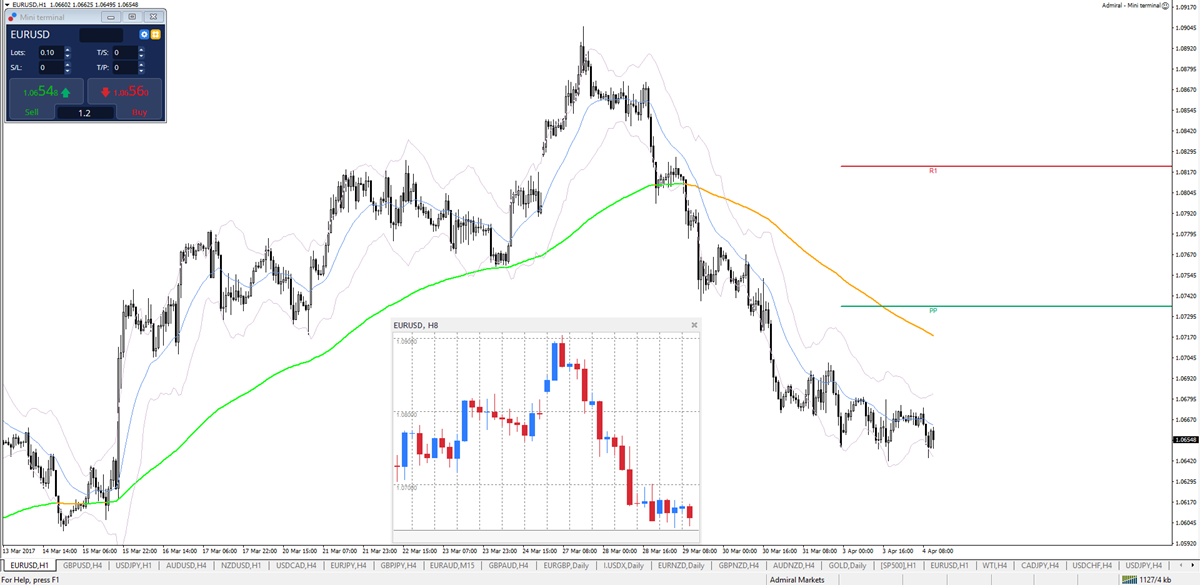
Benefit of the highest time frame
The highest time frames are primarily used for
spotting support and resistance (S&R) levels. I identify S&R via tops and bottoms, fractals, Fibonacci retracement and target levels as well as Admiral Keltner band.
The price could either be at or close to a S&R level – or a ‘decision zone’ as I call it. It can alsi be in the middle part, in between S&R levels:
- Price is at a key level: either breakout or bounce will occur.
- Price is in the middle: either a continuation or a pullback will occur.
If the price is at a key level, then I will monitor the reaction of the candles and price action to see if a breakout or bounce is more likely to occur.
Warning: this is when I want to avoid going long right into resistance or short into support. Also if the price does breakout, I want to keep an eye on a strong breakout candle to avoid false breaks (more in the video below).
If the price is in the middle of zone, then I will typically look at one time frame lower to see how strong the trend is and whether a continuation towards the next S&R or a retracement back to the previous S&R is more likely.
The video below also explains how I monitor price action and S&R.
Benefit of the middle time frame
The middle time frames are the best for
viewing trend, momentum, correction and patterns in general. This is where I look for trend channels, the position of price versus moving averages, how momentum (impulse) and correction are behaving, divergence patterns, and whether any chart patterns indicate reversal, continuation or range.
My main
purpose is to measure this:
- Is there a trend?
- Is there impulsive or corrective price action?
- Are there signs of exhaustion like divergence or reversal patterns?
- Are there signs of continuation patterns?
Most of the time I am looking for a
trending chart but not everyone needs to trade the same way, of course. I prefer trends myself more than ranges or reversals so I am analysing whether price will do one of the following:
- Immediately continue → interested in breakout.
- Build a retracement → interested in trading the bounce.
- Reverse → mostly not interested with some exceptions.
Benefit of lowest time frame
The middle time frames are the best for
finding the entry and taking a trade setup. This is the best trigger chart and it is useful for trading purposes.
Depending on analysis from the higher and middle times, I will typically look for one of the following:
- Breakout of a trend line.
- Break of a chart pattern.
- Bounce at a Fibonacci level.
- Bounce at moving average.
- My time factor pattern.
In most cases, I use candlestick patterns to confirm my entry point. For instance, with bounce setups, I will wait for a wick or exhaustion candle. With breakout setups, I will wait for strong candle closes.
Sometimes I exaggerate in finding a precise and ‘fancy’ entry, so at times I also set up pending orders. However, my confidence level in the setup has to be higher.
Cheers and safe trading,
Chris

Article by Admiral Markets
Source: My 4 Best Tips for Multiple Frame Trading

Admiral Markets is a leading online provider, offering trading with Forex and CFDs on stocks, indices, precious metals and energy.