By Admiral Markets
Dear Traders,
Perhaps you have already come across charts with funny-looking triangles or arrows above or below candlesticks. You probably wondered what these objects actually represent. Luckily, you’ve come to the right place.
The brilliant indicator we’re focusing on today is called the Fractal indicator, and it provides a wide range of benefits. Mainly, it helps identify support and resistance, understand the trend, and find entries.
Before we dive deeper, let me first explain the Fractal itself and how to add the indicator to the chart. Then we can actually discuss how this may help improve your trading.

So what is a fractal?
A fractal is a mathematical set that exhibits a repeating pattern displayed at every scale. This might sound complicated, so let’s break it down.
Free Reports:
 Get Our Free Metatrader 4 Indicators - Put Our Free MetaTrader 4 Custom Indicators on your charts when you join our Weekly Newsletter
 Get our Weekly Commitment of Traders Reports - See where the biggest traders (Hedge Funds and Commercial Hedgers) are positioned in the futures markets on a weekly basis.
Firstly, think of a fractal as a
curve or geometrical figure. An object is fractal if the same pattern occurs at every size. In essence, fractal explains natural objects and chaotic phenomena such as snowflakes, crystals, and even galaxy formations.
Fractals are connected to the “chaos theory”, which is a branch of mathematics focused on the behavior of dynamical systems such as weather, climate and other natural and even artificial (i.e. road traffic) systems.
Okay, now that we understand fractals a bit better, how exactly do they tie in with the markets?
Fractals in financial markets
Many traders see the financial markets—such as Forex, CFD and commodities markets—as fractal because the behavior of the markets is like a dynamical system that repeats on all time frames.
Simply said, I think that most traders will agree that market patterns are
continuously repeated:
- on all scales (timeframes)
- in a curve shape—price is moving up and down and forward in time
- with various speed (momentum) and movement (corrections).
Chart patterns, candlestick patterns, wave patterns and many more patterns repeat themselves regularly and confirm their Fractal nature. Legendary trader Bill Williams took the fractal and chaos concepts and transformed them into a
Fractal indicator which can actually be applied directly on a chart.

How do I place Fractal indicator on charts?
Good question. For
MT4 and MT4 Supreme Edition users, you can add the indicator by going to “Insert” -> “Indicators” -> “Bill Williams” -> “Fractals”. The Fractal indicator is a support and resistance indicator. The standard MT4 Fractal indicator “formula” is based on 5 candles and occurs in the following cases:
- Support Fractal: it appears on the chart when 1 candle has a low which is lower than 2 candles to its left and to its right.
- Resistance Fractal: it appears on the chart when 1 candle has a high which is high than 2 candles to its left and to its right.
The two candles to the left
and right is a minimum, but there is no maximum. A fractal will appear and stay on the chart even if there are 100 candles to the left and 50 candles to the right that are higher or lower.
How to use the Fractal indicator?
The Fractal indicator offers multiple advantages. Let’s overview 3 simple reasons why you should use this indicator.
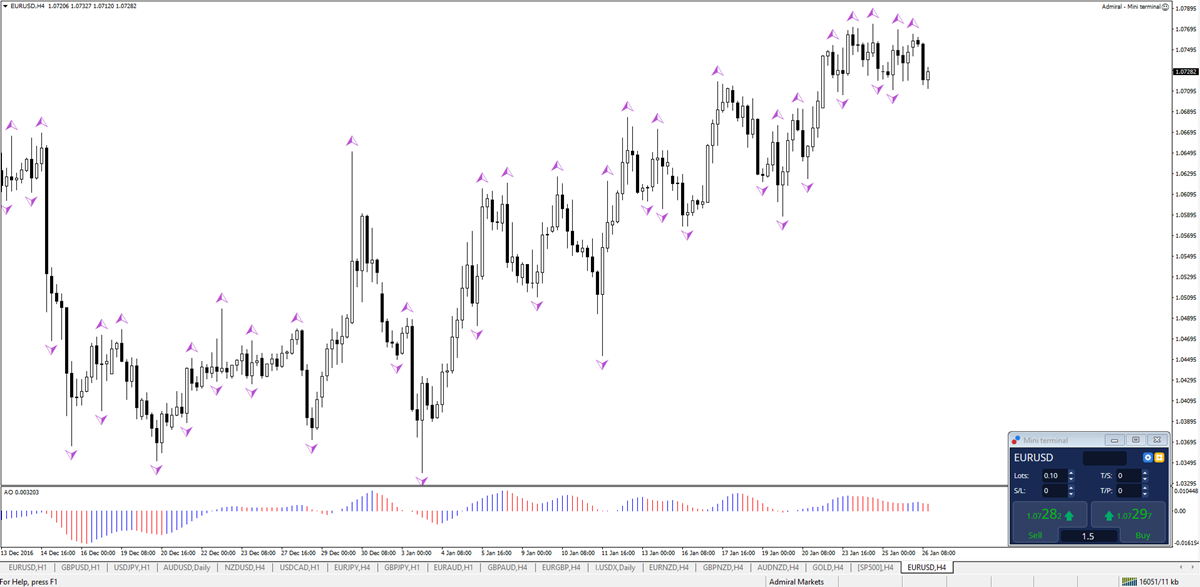
The
first benefit is the simplicity in viewing and digesting the charts. The fractals provide me with an immediate overview of the major support and resistance (S&R) levels.
This is effortless because the Fractal indicator is an indicator which is automatically updated. The S&R levels can also be used for filtering out a trade setup and for spotting major bounce or break spots.
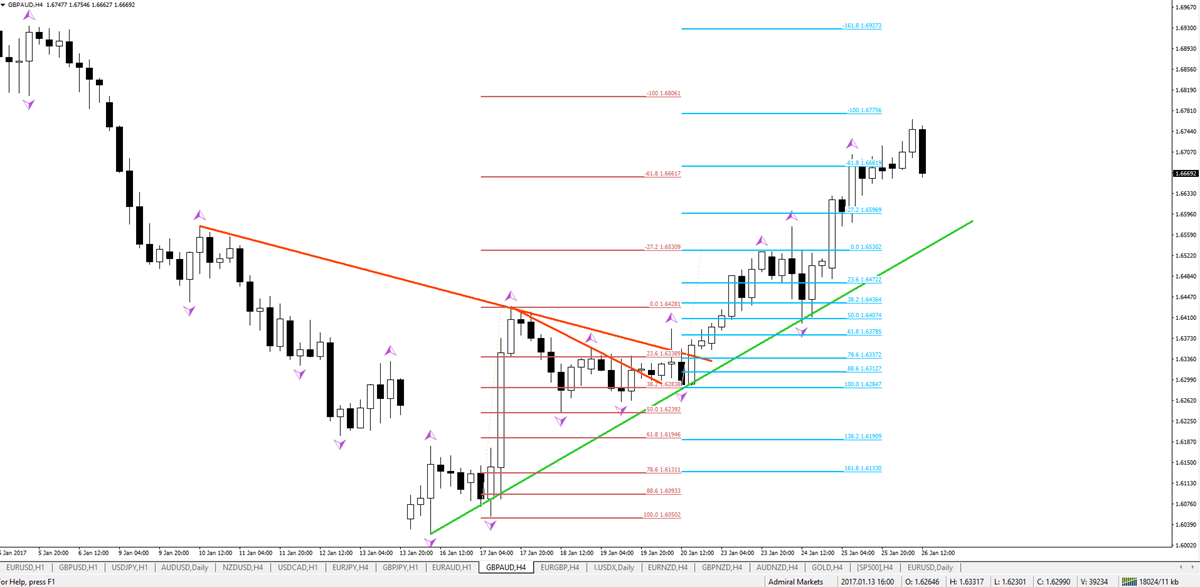
The
second benefit is that I like to connect trend lines with fractals. This also helps to identify the trend by checking the sequence of fractals (higher highs and lows or lower lows and highs). It is also possible to place a Fibonacci tool from fractal to fractal but make sure to see the presence of a trend or momentum.
The
third benefit is for trade entries and trade management. The break of fractals can be used for potential entry setups as price breaks through support or resistance (but make sure to test this within a clear trading system).
Fractals can also be used for placing a stop-loss (SL) below the closest or the second-closest fractal. A long setup would have a SL below the fractal support, whereas a short setup would go with a SL above fractal resistance. The same logic can be applied for a trail SL that would use newly formed fractals to reduce the risk or lock in profit.
How do I use the Fractal indicator?
Bill Williams tested the markets and came to the conclusion that the best fractal for commodity markets on the daily chart is
two. This is why the Fractal indicator is only visible when two candles to the left and right are lower or higher.
In the Forex market, however, I noticed that the fractal value of two is not optimal, especially for timeframes lower than a daily chart. In fact, I noticed that there is a time factor pattern that works very well for identifying the start and end of momentum and correction.
More information on this
time factor pattern and the best fractal value for Forex trading will be released in a new article during February. Here I will show you how I use my own custom Fractal indicator.
Cheers and safe trading,
Chris

Article by Admiral Markets
Source: Why Fractal Indicator Is Critical for Trading

Admiral Markets is a leading online provider, offering trading with Forex and CFDs on stocks, indices, precious metals and energy.