#C-SUGAR: Commodities Sugar Technical Analysis October 17, 2016
By IFCMarkets
Brazil raises sugar production
Sugarcane industry association Unica said Brazil increased sugar production in 2nd half of September to 2.95mln tonnes from 2.41mln tonnes in 1st half of September. Will it trigger downward correction of global sugar prices? There are many additional factors.
Sugar prices hit a fresh 4-year high two weeks ago. Amid this, Brazilian sugar plants sold sugar futures as on the end of September in the amount of 7.17mln tonnes at ICE exchange. This is 27% form the anticipated exports of Brazil in 2017/18 agricultural season. Just 19.7% of total exports were sold on the same date of previous season. High sugar prices stimulate Brazilian plants to increase not only sales but production also. The share of sugar cane used to produce ethanol (biofuel) has fallen to 49.8% from 57.5% in the same period of last year. So, cane processing into sugar rose to 50.2% from 42.5%.

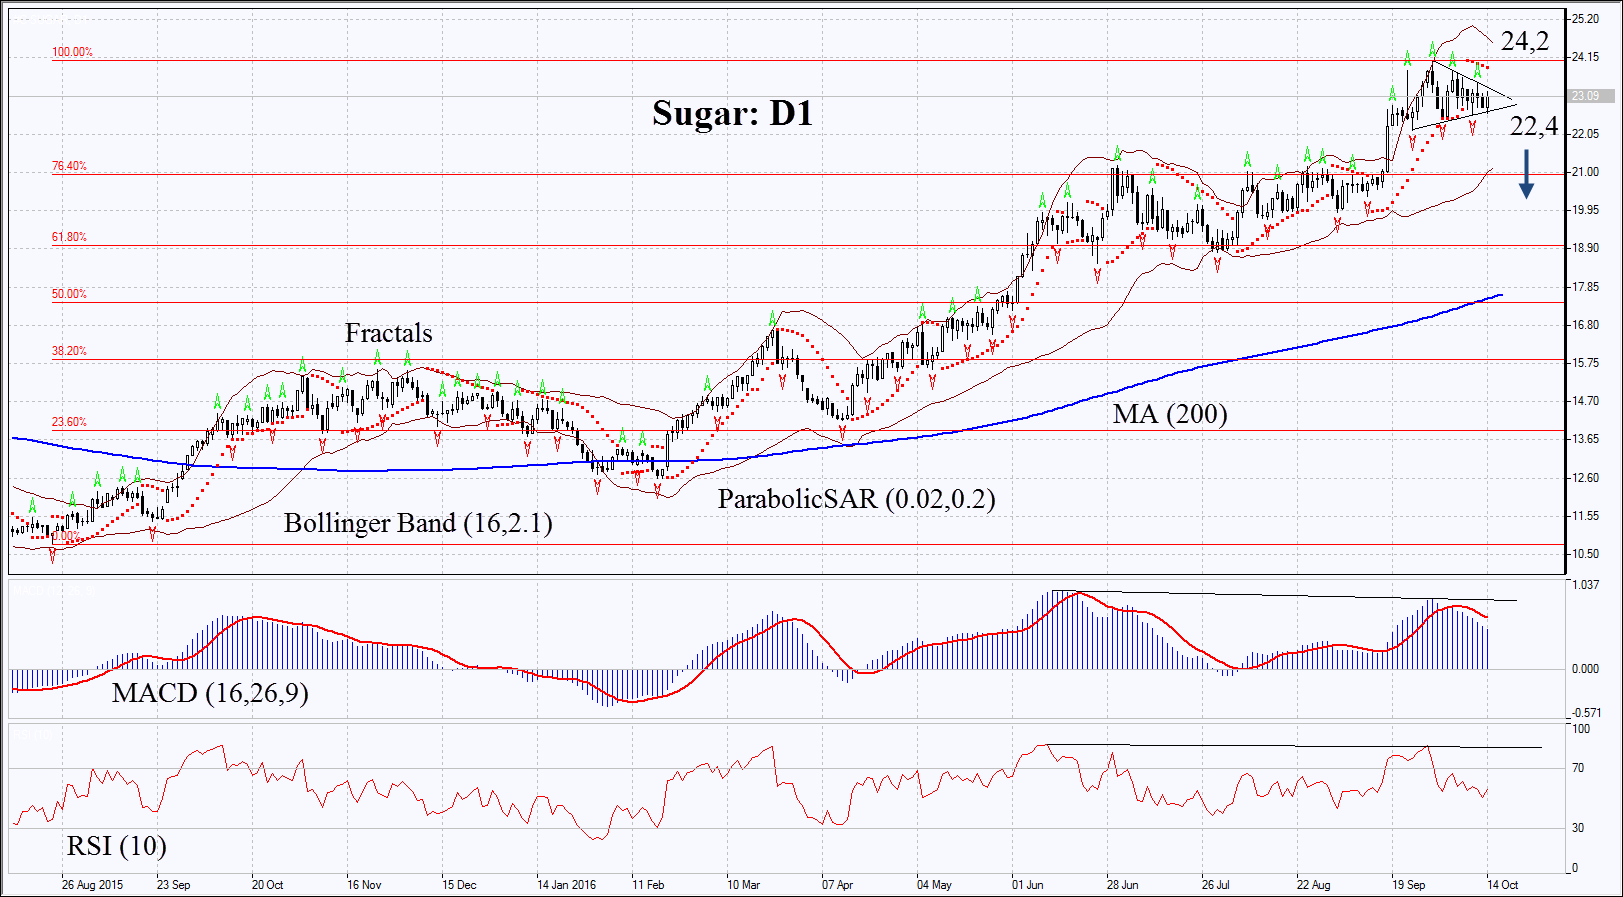

On the daily chart Sugar: D1 has advanced 54% since the start of 2016. In recent 2 weeks it is consolidating within the triangle. The downward correction is possible in case sugar prices rise in Brazil and US and if imports to China fall.
- Parabolic is giving bearish signals.
- Bollinger bands have narrowed a bit which means slightly lower volatility. They are tilted downwards.
- RSI is near 50, no divergence.
- MACD is giving bearish signals.
The bearish momentum may develop in case Sugar prices fall below the support of triangle and two last fractal lows at 22.4. This level may serve the point of entry. The initial stop-loss may be placed above the 4-year high at 24.2. Having opened the pending order we shall move the stop to the next fractal high following the Parabolic and Bollinger signals. Thus, we are changing the probable profit/loss ratio to the breakeven point. The most risk-averse traders may switch to the 4-hour chart after the trade and place there a stop-loss moving it in the direction of the trade. If the price meets the stop-loss level at 24.2 without reaching the order at 22.4, we recommend cancelling the position: the market sustains internal changes which were not taken into account.
Free Reports:


Summary of technical analysis
| Position | Sell |
| Sell stop | below 22.4 |
| Stop loss | above 24.2 |
Market Analysis provided by IFCMarkets