By IFCMarkets
Strong August jobs report will pressure gold
A strong August nonfarm payrolls report will increase the likelihood of a September interest rate hike, lifting the US dollar and pressuring gold. Will gold continue falling?
Gold price has declined a little over 1% after Federal Reserve Chair Janet Yellen said last Friday at Jackson Hole symposium improving US economy strengthened the case for a rate increase. Investors are waiting for the August job report: an increase in nonfarm payrolls above 200000, which is the number of new jobs on a monthly basis needed to employ just new entrants into the labor market due to demographic change, will give the central bank the justification to raise rates in September. Gold has been falling as expectations for a rate hike this year have been rising following recent positive economic data. Particularly, Conference Board reported Tuesday US consumer confidence rose to an 11-month high in August, payroll processor Automatic Data Processing Inc. reported on Wednesday private-sector employment rose 177000 in August against the expected 175000 growth, and pending home sales at 1.3% over month in July reached the second-highest reading in a decade. Against the background of increasingly bullish statements by Federal Reserve officials about central bank’s readiness to raise rates as US economy approaches full employment state, holdings of SPDR Gold Trust, the world’s largest gold-backed exchange-traded fund, posted the first monthly decline in August in four months. They fell 1.6% for the month to 943.23 tonnes on Wednesday. A strong August nonfarm payrolls report will increase the chances of a rate hike in September, putting additional pressure on gold: stronger dollar makes gold more expensive for users of other currencies and rising interest rates increase the opportunity cost of holding non-yielding gold.
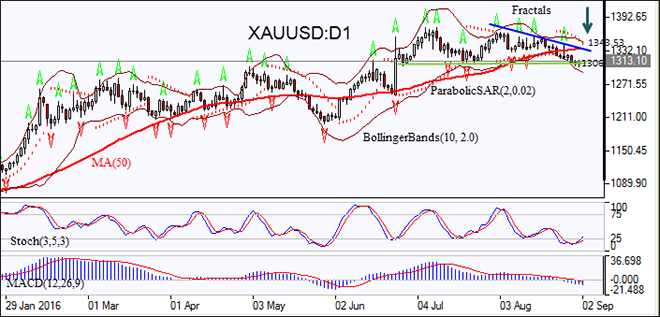
XAUUSD: D1 has traded lower in daily timeframe since the release of surprisingly strong July jobs report on August 5. It has fallen below the 50-day moving average MA(50) and has breached below the support level around $1306 an ounce.
- Parabolic indicator gives a sell signal.
- Bollinger bands have widened indicating increasing volatility.
- The MACD indicator also gives a bearish signal.
- The stochastic oscillator is in the oversold zone, which is a bullish signal.
We believe the bearish momentum will continue after the price closes below the support at $1306. A pending order to sell can be placed below that level. The stop loss can be placed above the last fractal high at $1343.53. After placing the order, the stop loss is to be moved every day to the next fractal high, following Parabolic signals. Thus, we are changing the probable profit/loss ratio to the breakeven point. The most risk-averse traders may switch to the 4-hour chart after the trade and place there a stop-loss moving it in the direction of the trade. If the price meets the stop loss level ($1343.53) without reaching the order($1306) , we recommend cancelling the position: the market sustains internal changes which were not taken into account.
Free Reports:
 Get Our Free Metatrader 4 Indicators - Put Our Free MetaTrader 4 Custom Indicators on your charts when you join our Weekly Newsletter
 Get our Weekly Commitment of Traders Reports - See where the biggest traders (Hedge Funds and Commercial Hedgers) are positioned in the futures markets on a weekly basis.
Technical Analysis Summary
| Position | Sell |
| Sell stop | Below 1306 |
| Stop loss | Above 1343.53 |
Market Analysis provided by IFCMarkets