By The Gold Report
Source: Bob Moriarty for The Gold Report 09/15/2016
View Original Article: https://www.streetwisereports.com/pub/na/the-cme-read-my-book
Bob Moriarty of 321 Gold discusses the benefits of trading on the gold/silver ratio and gold/platinum spread, and the new contracts the CME is launching next month.

In Nobody Knows Anything I spend some time discussing the silver/gold ratio and the gold/platinum spread. Given an entry at a favorable time, both trades are low risk and high potential with gold and platinum or silver doing nothing more than regressing to the mean.
On September 15th, the CME announced new products coming October 24th including a silver/gold ratio contract and a gold/platinum spread contract. These new contracts will be the lowest cost way to do these trades. As I write, gold has a $286 premium to platinum and it takes 69.3 ounces of silver to buy one ounce of gold. The highest spread between gold and platinum was just after the Brexit vote in late June at $350. The silver/gold ratio hit 84:1 in March. These trades need no brains, only patience.
Free Reports:
 Get Our Free Metatrader 4 Indicators - Put Our Free MetaTrader 4 Custom Indicators on your charts when you join our Weekly Newsletter
 Get our Weekly Commitment of Traders Reports - See where the biggest traders (Hedge Funds and Commercial Hedgers) are positioned in the futures markets on a weekly basis.
Chapter 3
Deviation and Regression to the MeanRELATIONSHIPS EXIST between both similar and dissimilar commodities. The ratio of the number of ounces of silver it takes to buy one ounce of gold varied from about 17:1 in January of 1980 to over 100:1 in early 1991. We view both metals as precious and having some aspects of money. But the ratio changes a lot and that creates an opportunity to profit without needing the ability to predict direction of price movement. You don’t need to speculate on the commodities going up or down, only that they regress to a mean.
And it’s not necessary for commodities to be similar. For some reason sugar and silver seem to move together much of the time. There is no necessity for a logical relationship in order for there to be an actual relationship.
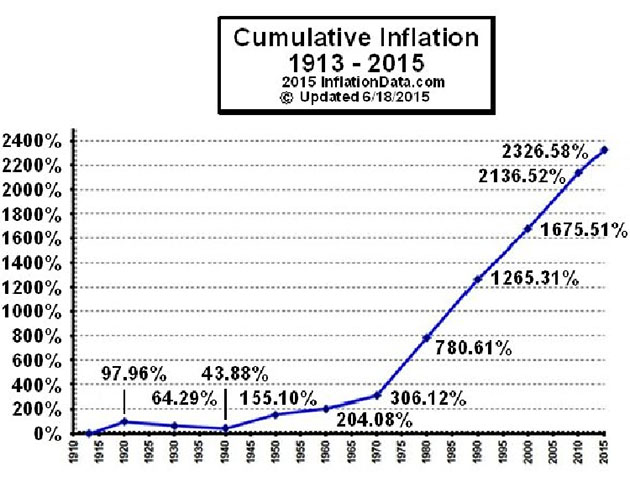
To understand deviation from the mean, we first need some basic understanding of what makes prices change. That’s easy. The answer is inflation. But inflation distorts price information and while eventually everything goes up because of inflation, things go up at different rates because the market doesn’t know at any given time what the correct price is for anything and is constantly testing.
For each pair of commodities that we might seek to profit from there will be a different chart, but basically it’s all about deviation from the mean of inflation and regression to the mean.
Going back over the past 100 years, if we chose to use silver vs. gold as our means of investing for a profit, the ratio has varied from 17:1 to 100:1 but had a mean of 53:1. Do remember that the price of gold was fixed at $20.67 an ounce until Roosevelt took the public off the gold standard in 1933 and revalued gold at $35 in January of 1934. While the price of silver varied between 1934 and 1971, gold remained relatively constant until Nixon took us totally off the gold standard in August of 1971. Since that time both metals have traded freely and have offered numerous opportunities to profit.
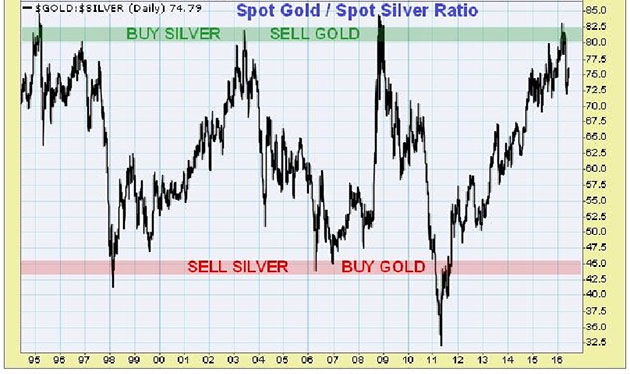
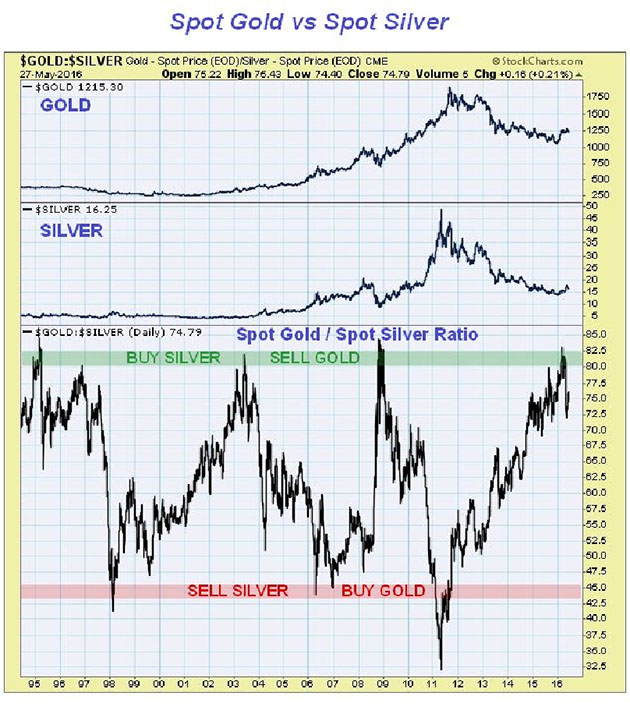
There are a number of different ways an investor could have capitalized during the period shown in the chart. The first clear signal was when the silver to gold ratio went above 85, in 1995. Since there are more options now, I’ll cover what the options were then.
Since you get many ounces of silver for each ounce of gold, one alternative for the punter is to sell gold and buy silver at the same time and in about the same dollar value. Twenty years ago pretty much the only choice was the use of commodity contracts. A ratio spread of buying silver/selling gold would have carried far less margin requirement than a naked position in either commodity. I’m going to use big numbers as an example but only because there were fewer options then.
A standard silver contract is 5,000 ounces and a standard gold contract is 100 ounces. On March 2, 1995 gold was $375 an ounce and silver was $4.40. The ratio of silver to gold was thus 85:1. There were also 1,000-ounce silver contracts available, so the thing to do would have been to short 100 ounces of gold and go long either 7,000 or 8,000 ounces of silver. Because of the reduced opportunities to trade various alternatives, you couldn’t match the dollar amounts perfectly.
What is most important to understand about trading on deviation from the mean is that you do not need to make a directional bet. While it was true that silver was cheaper relative to gold, it didn’t and doesn’t necessarily mean that silver was going to go higher. Regression to the mean only means that it should go higher relative to gold. You don’t really care if the metals go up or down, you only care that the relative value changes.
Another simple alternative would have been to just sell gold since it had deviated the most from the mean, and take the money from that to buy silver. That presumes the investor had a stash of gold.
The investor would have needed to stay in the investment for just about three years, for on February 6, 1998 gold went to $299 as silver hit $7.80 for a ratio of 38:1. So the investment above would have showed a profit of $76 an ounce for $7,600 on the gold short and $23,800 for the silver long. Obviously no one picks perfect tops and bottoms but what I’m trying to show is that by investing when ratios deviate from the mean, there can be a lot of profit.
If all the investor had done was to sell three ounces of gold in 1995 for a total of $1,125 and put that money into silver at $4.40, and then reversed the trade in 1998, he would have ended up with six ounces of gold in 1998. If you own gold, silver and platinum, you can continue to increase your total number of ounces at a relatively low risk. It’s all based on historical data, deviation from the mean and regression to the mean.
The trade offered a second entry point in December of 1996. As long as the investor understands that all he is betting on is regression to the mean, this second entry point was nearly as good as the first. Understand that when the spread passes 80 it doesn’t last long and there is no fundamental or technical reason for it to stay above 80. It’s going to regress to the mean and beyond.
There was another buy silver/sell gold signal in mid-2003 that lasted until early 2006. And another buy gold/sell silver signal in 2007 that reversed direction in late 2008.
In 2011 silver shot higher, to almost $50 an ounce. Entry into the buy gold/sell silver at 45 would have been unprofitable for a few months, but sure enough silver went back to a ratio of 84:1 to gold in March of 2016, offering yet another trade.
These trades take years but returns of above 30-35 per cent are consistent and will remain so over the future. No matter what is happening in the economy, there is a relationship between the prices of gold and silver. While they may deviate from the mean, eventually they return to the mean.
We like to believe we can make profitable investments at no cost on our part but it’s simply not so. When you are using deviation from the mean and regression to the mean as a source of signal, you need the basic data to make intelligent decisions. I’ve been on the web for over twenty years in one form or another. The very best source of information that I am aware of for charts showing deviation and regression would be that of sharelynx.com, run by the incredible Nick Laird from Australia.
Nick gives new readers a three-week trial for free. If it gives you what you need, you have a choice of one year for $200 or two years for $360. A single trade would more than pay for your subscription.
Understanding deviation from the mean can be very valuable in other ways than just a single trade. For example I wrote a piece in early March of 2016 in which I pointed out that relative to commodities in general, the gold price was the highest it had been in history. Relative to 5,000 years of record keeping, commodities were cheaper in real terms than they had ever been. Platinum was selling at a $320 discount to gold, also a record low for platinum. Silver was selling at a ratio of 84 ounces for each ounce of gold. That was near the highest it had ever been. Oil had hit the highest ratio to gold it had ever been, at 48 barrels of oil to one ounce of gold. Even during the darkest days of the Great Depression oil was only 40 barrels per ounce. Clearly a few weeks ago we had a significant deviation from the mean.
Those are all signals. In the ten days since I wrote the piece and called gold expensive (in relative terms), platinum gained $45 on the spread, silver improved to an 80:1 ratio, and commodities shot up by 12 per cent. Oil advanced by an incredible 50 per cent in three weeks since its low at $26 a barrel. My point is not that I am so smart; I’m not any smarter than you. But all this information provides signals that will help you make more intelligent decisions about what to do with your money.
If an advisor isn’t going to share your pain, why should you give him any of the gain? It’s your money. The information is easy to find, and while the Internet is not the font of all wisdom, there is an incredible amount of valuable information if you will only learn to think and use the tools available to you.
It’s vital that average investors realize that most of the information available to them on the web is noise. Everything you get from the mainstream media is noise designed to confuse rather than enlighten. And I mean everything. The mainstream media is so far past its sell-by date they should all resign and get real jobs. There is good information on the web but you have to sift out all the garbage. Investing based on the information you get from understanding relationships between commodities is fairly consistent.
If you trade the silver/gold spread, buying gold and selling silver has worked four times in the last twenty years if you use a ratio of 45:1. Buying silver and selling gold has worked five times in the last 20 years if you use a ratio of 80:1 to sell the gold and buy the silver. These are boring trades that you enter and just go to sleep. A trading signal that works every time and comes along every two years or so is not a bad deal. Consistent returns of over 33 per cent add up over time.
Just as a matter of interest, silver has been above 80:1 lately as I write in March of 2016 and there’s a wonderful opportunity to profit. You can buy silver and not need the excuse of manipulation or a massive conspiracy to justify your investment.
For more investment advice that you can use forever, go to Amazon and spend $6.49 for a book other readers call the best book on investing they have ever read.
Bob and Barb Moriarty brought 321gold.com to the Internet almost 14 years ago. They later added 321energy.com to cover oil, natural gas, gasoline, coal, solar, wind and nuclear energy. Both sites feature articles, editorial opinions, pricing figures and updates on current events affecting both sectors. Previously, Moriarty was a Marine F-4B and O-1 pilot with more than 820 missions in Vietnam. He holds 14 international aviation records.
Want to read more Gold Report interviews like this? Sign up for our free e-newsletter, and you’ll learn when new articles have been published. To see a list of recent interviews with industry analysts and commentators, visit our Streetwise Interviews page.
Disclosure:
1) Statements and opinions expressed are the opinions of Bob Moriarty and not of Streetwise Reports or its officers. Bob Moriarty is wholly responsible for the validity of the statements. Streetwise Reports was not involved in any aspect of the article preparation or editing so the author could speak independently about the sector. Bob Moriarty was not paid by Streetwise Reports for this article. Streetwise Reports was not paid by the author to publish or syndicate this article.
2) This article does not constitute investment advice. Each reader is encouraged to consult with his or her individual financial professional and any action a reader takes as a result of information presented here is his or her own responsibility. By opening this page, each reader accepts and agrees to Streetwise Reports’ terms of use and full legal disclaimer. This article is not a solicitation for investment. Streetwise Reports does not render general or specific investment advice and the information on Streetwise Reports should not be considered a recommendation to buy or sell any security. Streetwise Reports does not endorse or recommend the business, products, services or securities of any company mentioned on Streetwise Reports.
Charts provided by Bob Moriarty

