By IFCMarkets
Japanese yen fell against the US dollar after the Janet Yellen’s speech on Friday. She said the state of the US economy gives more and more ground for raising interest rates. Positive labour market data, PMIs and inflation support this stance. Nevertheless, the Fed Chair gave on hints on rate hike timing. Will USDJPY continue rising?

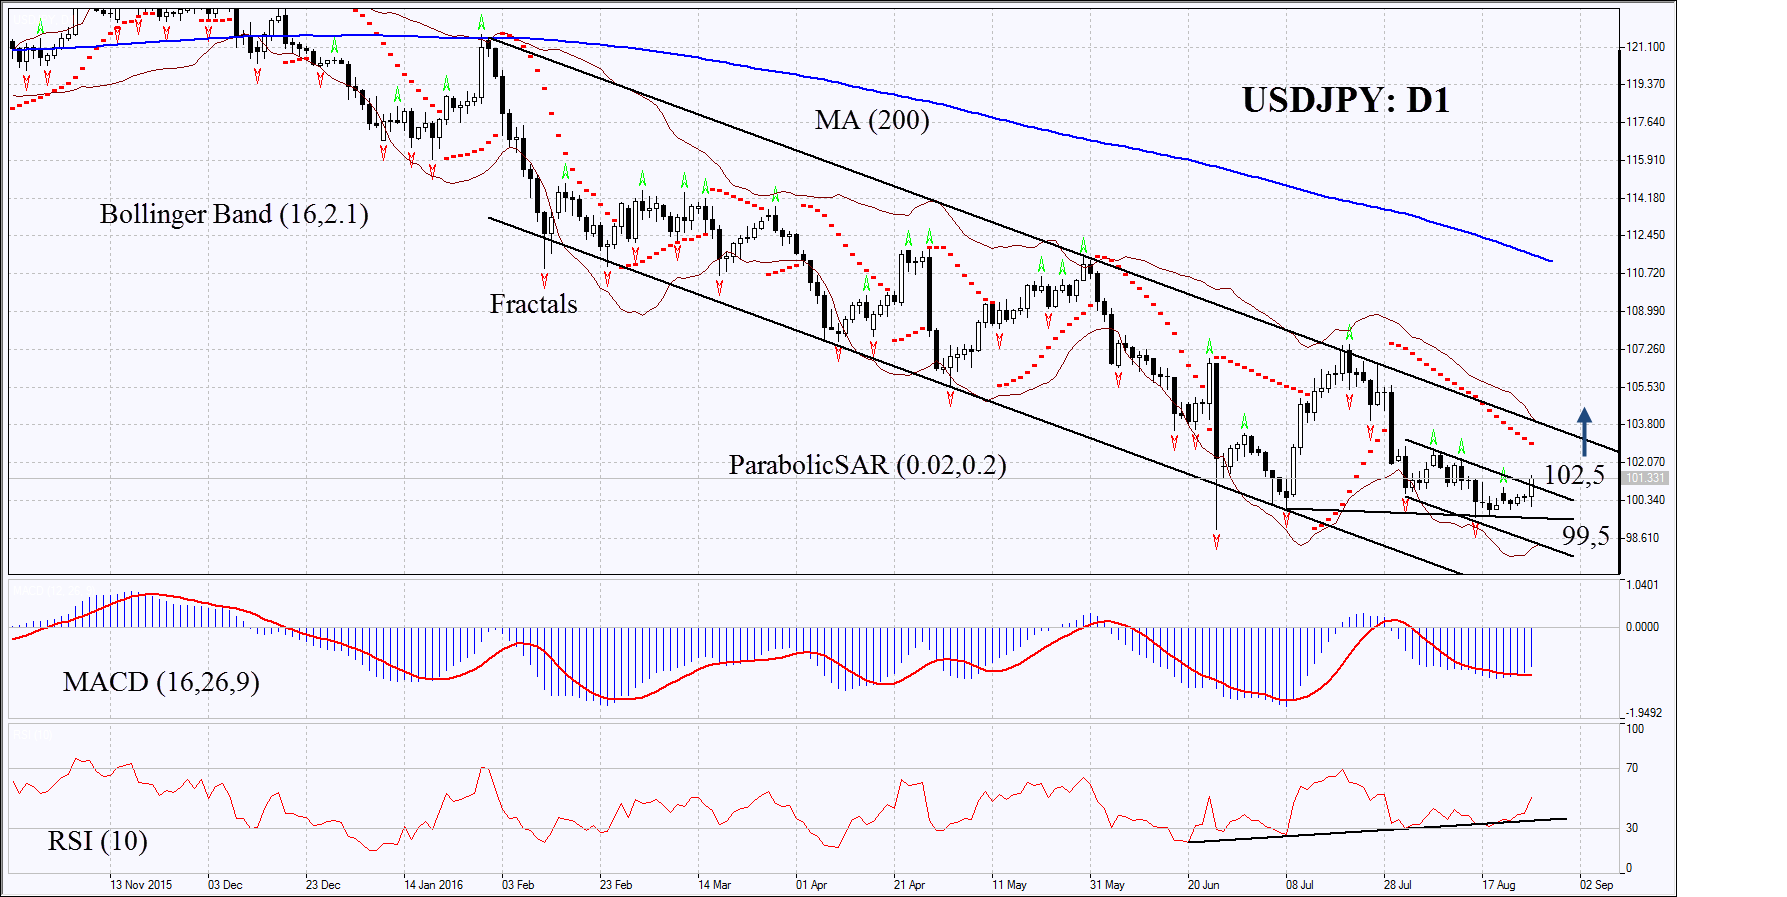
On the daily chart USDJPY: D1 has been in a downtrend for the whole year. Two months ago the yen hit a fresh 2.5-year low and started correcting up. The chances for the rate hike on the next Fed meeting on September 21-22 rose slightly after the Yellen’s speech. At the same time it did not surpass the level of 25%. However, there are some purely Japanese reasons for yen weakening. Previous week the Bank of Japan’s Governor Haruhiko Kuroda said he does not exclude the further quantitative easing. Investors decided he implied even lower negative interest rates (current rates in Japan are -0.1%). The idea to go further negative is supported by the fact that core deflation rose to -0.5% on yearly basis in July from -0.4% in June. The core consumer price index fell for 5th consecutive month to hit a 3-year low. Bank of Japan may also raise the annual volume of quantitative easing which is now 80trn yen. The Bank may take some steps on its next meeting on September 21, 2016. Next Tuesday the significant data will come out in Japan: unemployment and retail sales. The significant monetary easing may support the USDJPY rate.
- MACD has formed signal to rise.
- At the same time the Parabolic has not reversed up and still gives the bearish signal. It may serve an additional level of resistance to be surpassed.
- The Bollinger bands have narrowed a lot which means lower volatility.
- RSI has surpassed the level of 50 but has not yet reached the oversold zone. It has formed positive divergence.
The bullish momentum may develop in case the USDJPY surpass the thee upper fractal highs and the Parabolic signal at 102.7. This level may serve the point of entry. The initial stop-loss may be placed below the Parabolic signal and the last fractal low at 99.5. Having opened the pending order we shall move the stop to the next fractal low following the Parabolic and Bollinger signals. Thus, we are changing the probable profit/loss ratio to the breakeven point. The most risk-averse traders may switch to the 4-hour chart after the trade and place there a stop-loss moving it in the direction of the trade. If the price meets the stop-loss level at 102.7 without reaching the order at 99.5, we recommend cancelling the position: the market sustains internal changes which were not taken into account.
Summary of technical analysis
| Position | Buy |
| Buy stop | above 102.7 |
| Stop loss | below 99.5 |
Market Analysis provided by IFCMarkets