By IFCMarkets
External trade deficit rose in Canada in May to С$3.28bn which is much worse than previously expected. The April forecast was revised down from preliminary minus С$2.94bn to historical high of minus С$3.32bn. The external trade deficit is observed in Canada for 21 straight months already. Will it push the Canadian dollar lower? In USDCAD chart it will look as increase.
In our opinion, the deficit looks even bigger amid higher energy exports. The main bodies of fire that cramped oil production were liquidated in May in Canadian province of Alberta. As a result, energy exports showed record growth since May 2014 of 7.1%. Oil and bitumen sales surged 10.5%. Obviously, this did not help improve general figures in external trade. In the first 5 months of 2016 the accumulated trade deficit reached in Canada С$12.3bn or about 0.7% of its GDP. Important data on Canada’s labour market for June will come out on Friday. The tentative outlook is quite negative. The less significant Ivey PMI for June will come out on Thursday. It is expected to be more or less strong which supports the Canadian dollar. Another negative factor for loonie is risk of non-ratification of trade agreement between Canada and EU in the aftermath of Brexit. For now it is scheduled on mid-autumn this year.
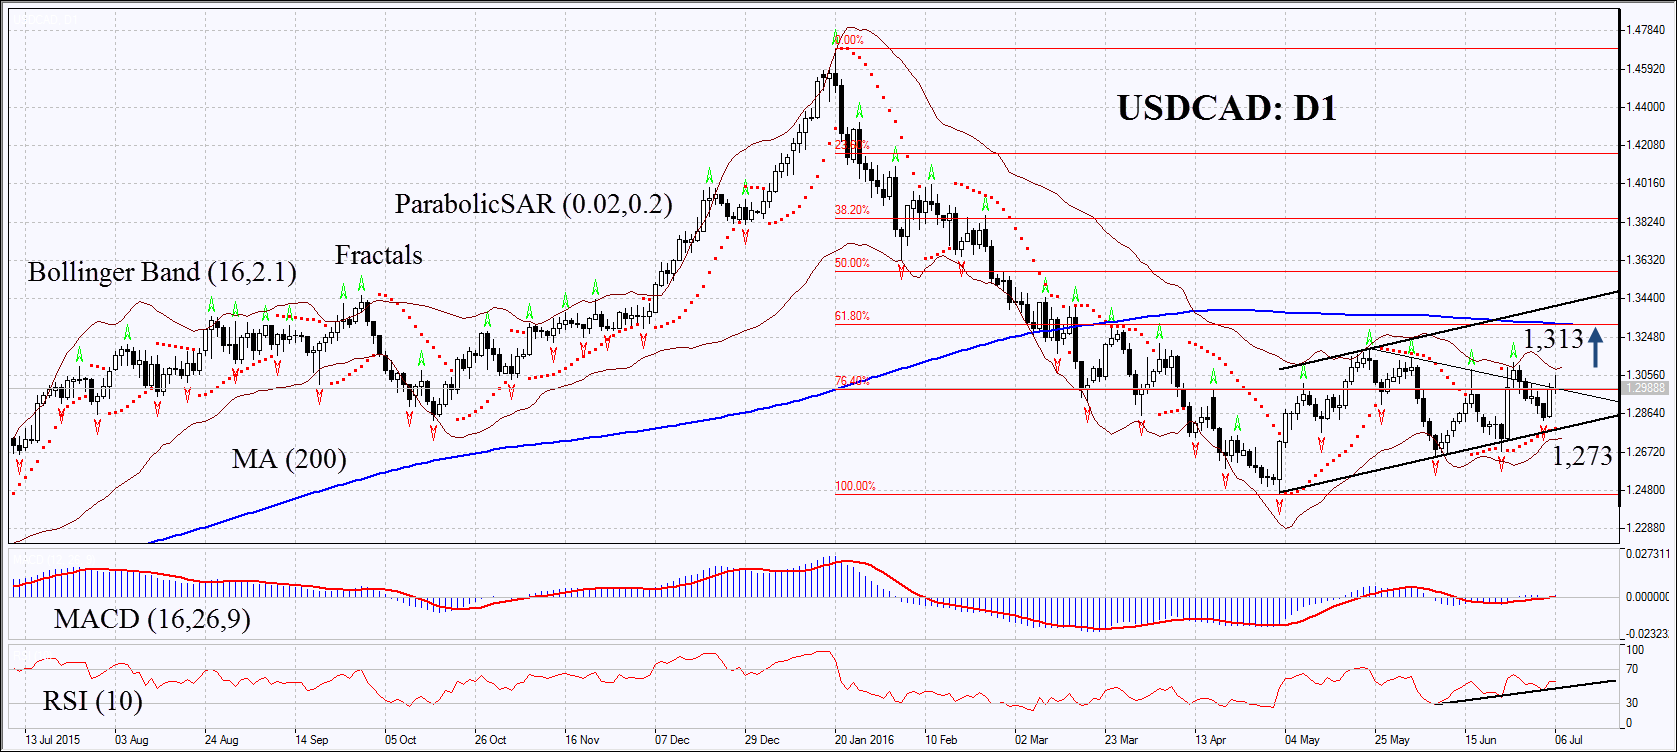
On the daily chart USDCAD: D1 continues rising and struggling to break up through the upper side of a triangle. The MACD and Parabolic give signals to buy. The Bollinger bands have contracted a lot which means lower volatility. RSI is above 50, no divergence. The bullish momentum may develop in case the Canadian dollar surpasses the last fractal high and Bollinger band at 1.313. This level may serve the point of entry. The initial stop-loss may be placed below the Parabolic signal, the last fractal low, the support of the uptrend, the lower Bollinger band and the multi-month low at 1.273. Having opened the pending order we shall move the stop to the next fractal low following the Parabolic and Bollinger signals. Thus, we are changing the probable profit/loss ratio to the breakeven point. The most risk-averse traders may switch to the 4-hour chart after the trade and place there a stop-loss moving it in the direction of the trade. If the price meets the stop-loss level at 1.273 without reaching the order at 1.313, we recommend cancelling the position: the market sustains internal changes which were not taken into account.
| Position | Buy |
| Buy stop | above 1.313 |
| Stop loss | below 1.273 |
Market Analysis provided by IFCMarkets