By IFCMarkets
US Fed Chair Janet Yellen outlined on Monday four major risks for the US economy: slowdown in demand, productivity, inflation and risk of global economic slowdown. At the same time, she left room open for further interest rate hike but did not precise the terms. Will the precious metals and silver in particular advance?
The weak jobs data for May 2016 released on Friday were a rude awakening for investors and Fed. The nonfarm payrolls fell to the lowest since September 2010 of just 38 thousand. Now market participants price in the 5% chances of the Fed rate hike on June 15 and 34% chances for the hike on July 27. The vast majority of investors believe the Fed is to raise the rates only once this year instead of two times previously expected. The May inflation was 1.1% in US year on year almost equal to the 1,2% yields of 5-year US bonds. This may push up the demand for precious metals. Silver may become more appealing than gold. The Silver ETF Physical Holdings are close to the historical highs while the Total Gold ETF Physical Holdings are about one third below the historical high. 30% of industrial silver is used to produce solar batteries (PVs) and its price hugely depends of trends in global alternative energy sector.

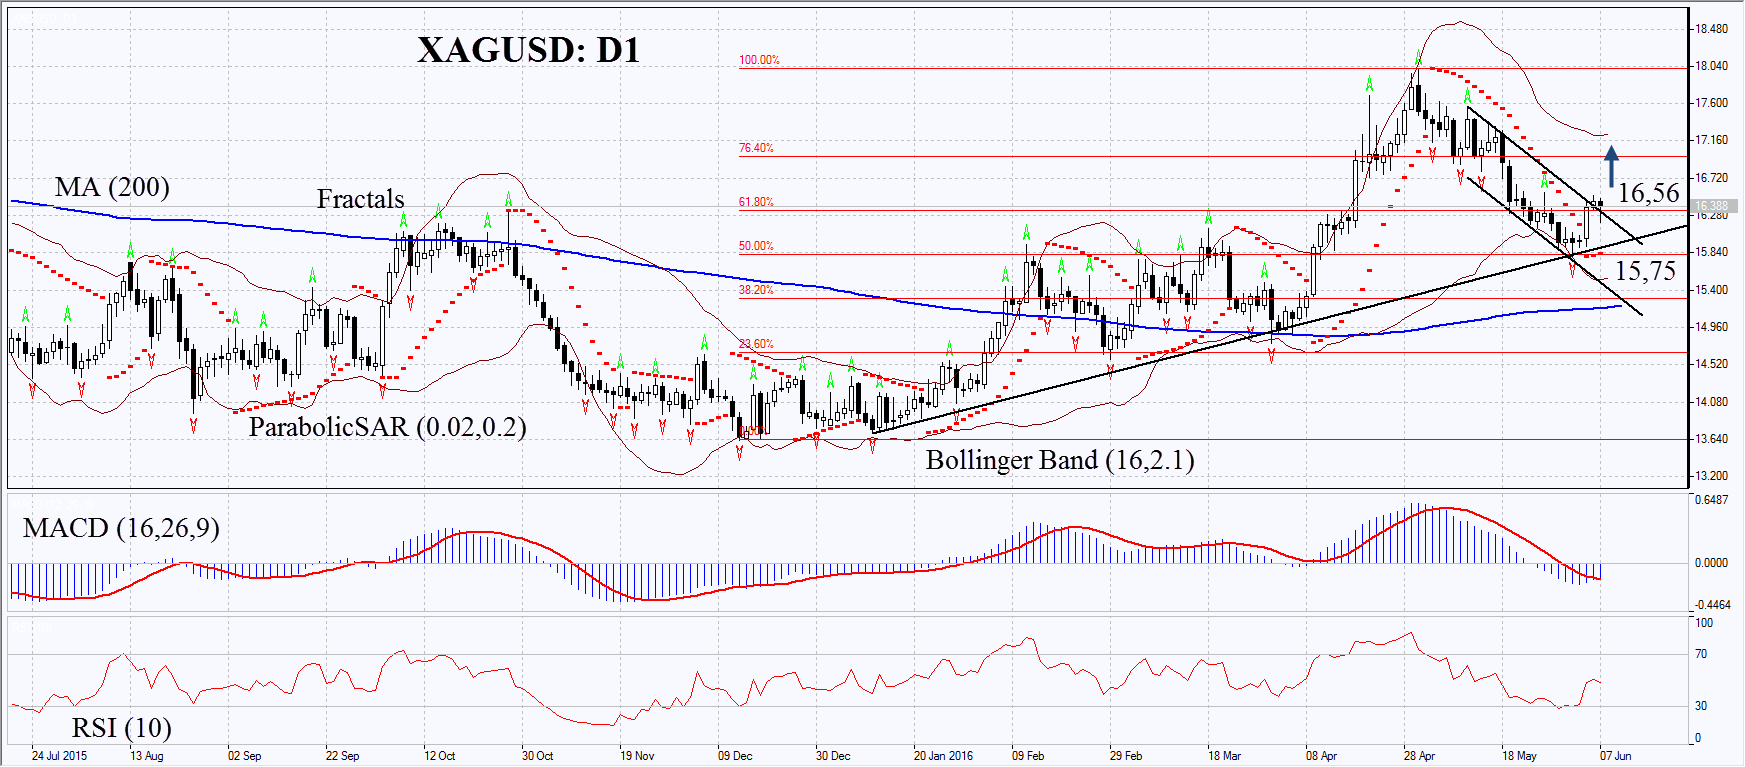
On the daily chart XAGUSD: D1 has corrected towards the 50% Fibonacci retracement and the support of the midterm rising trend but failed to break through them. After than the silver prices slightly edged up and are struggling for resting above the resistance of the short term downtrend. The MACD and Parabolic indicators give signals to buy. RSI is neutral near 50, no divergence. The Bollinger bands have widened which means higher volatility. The bullish momentum may develop in case silver surpasses the last fractal high at 16.56. This level may serve the point of entry. The initial risk limit may be placed below the support of the uptrend, the Parabolic signal and the last fractal low at 15.75. Having opened the pending order we shall move the stop to the next fractal low following the Parabolic and Bollinger signals. Thus, we are changing the probable profit/loss ratio to the breakeven point. The most risk-averse traders may switch to the 4-hour chart after the trade and place there a stop-loss moving it in the direction of the trade. If the price meets the stop-loss level at 15.75 without reaching the order at 16.56 we recommend cancelling the position: the market sustains internal changes which were not taken into account.
| Position | Buy |
| Buy stop | above 16.56 |
| Stop loss | below 15.75 |
Market Analysis provided by IFCMarkets