By IFCMarkets
S&P 500 stock market index has been declining on Tuesday for the 4th straight day ahead of the UD Fed meeting on Wednesday, June 15. Investors believe the rates will not be hiked as the US Fed may point at faltering economic growth. The Fed funds futures price in 17.9% chances for the rate hike on July 27 and in 29% on September 21, according to CME Group. Moreover, the chances for the Fed rate hike before the February 2017 are estimated at 40% now. The main reason for such pessimism is weak growth of US economy. Will S&P 500 index continue correcting down?
The US stocks may fall in price mainly as they are overpriced compared to the key economic indicators. The May retail sales data came out on Tuesday in US. Their growth slowed down in June to 0.5% compared to previous increase of 1.3% but anyway it supported the investors’ confidence. The US dollar index rose. The US GDP is still expected to grow 2.5% in Q2 which is not that bad in fact. Nevertheless, market participants are worried S&P 500 is being near its historical high with Р/Е ratio of 19.5 while the ratio is forecasted to be 16.8 in the following 12 months. The average historical P/E from 1950 is far below at 14.1. For this reason, several Western banks including Goldman Sachs expect US stock market indices to fall. The main reason is that the forecasted Р/Е of S&P 500 is almost 20% above the historical average while the US economic expansion is to be 2% or even less in 2016-2017. Given all mentioned above, S&P 500 may retrace to close the gap, so by around 18%. In case of market turmoil it may retrace even more. Let us remind you that S&P 500 rose more than threefold from the low of previous economic crisis hit in March 2009.
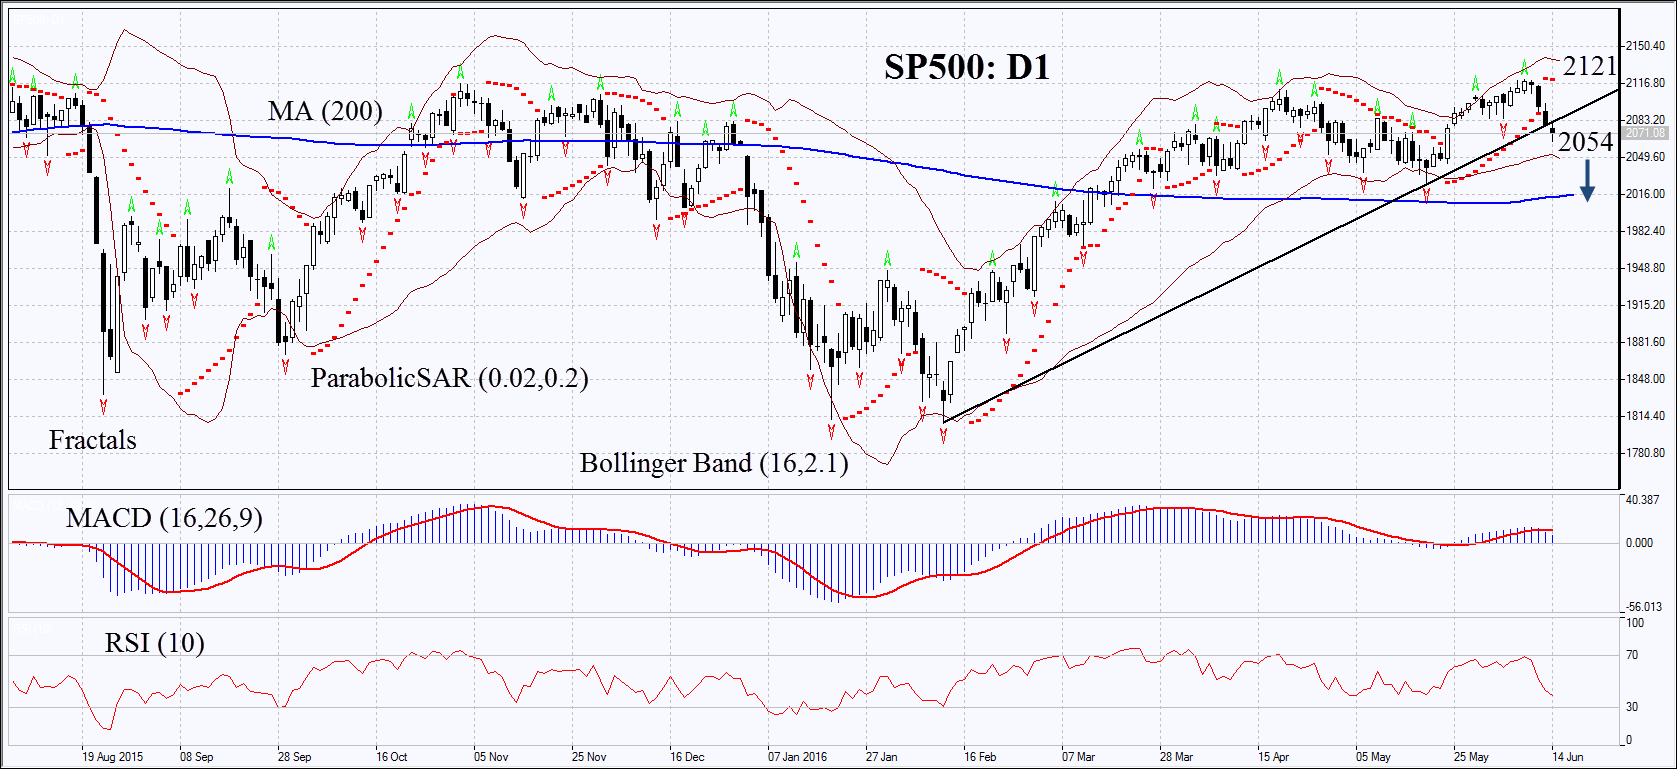
On the daily chart SP500: D1 failed to surpass the historical high last week and started correcting down. Now it has fallen below the support of the long-term rising trend. The MACD and Parabolic indicators give signals to sell. RSI is below 50 but has not yet reached the oversold zone, no divergence. The Bollinger bands have widened which means moderate volatility. The bearish momentum may develop in case S&P 500 falls below the Bollinger band at 2054. This level may serve the point of entry. The initial stop-loss may be placed above the Parabolic signal and the 13-month high at 2121. Having opened the pending order we shall move the stop to the next fractal high following the Parabolic and Bollinger signals. Thus, we are changing the probable profit/loss ratio to the breakeven point. The most risk-averse traders may switch to the 4-hour chart after the trade and place there a stop-loss moving it in the direction of the trade. If the price meets the stop-loss level at 2121 without reaching the order at 2054 we recommend cancelling the position: the market sustains internal changes which were not taken into account.
| Position | Sell |
| Sell stop | below 2054 |
| Stop loss | above 2121 |
Market Analysis provided by IFCMarkets