By IFCMarkets
Wheat prices have been rallying recently as heavy rains flooded France’s grain production areas. Excess rains are forecast for Europe next week too, including France, Europe’s top wheat producer. Will the wheat price continue rallying following the forecasts?
Wheat prices have been advancing as France’s biggest grain production areas south of Paris were flooded last week. While the European Commission raised its outlook for soft wheat production by more than 2 million tonnes in late May to 145.1 million tonnes, wheat prices reached highest in months on concerns of negative impact on France’s crops from heavy rain during flowering and the threat from fusarium fungus which may spread due to resulting soggy conditions. Forecasts of excess additional rains for Europe next week, particularly France, European Union’s top wheat producer nation, provide continued support for wheat. Today US Department of Agriculture’s monthly WASDE global crop supply and demand report will be released, which may bring higher volatility if crop estimates differ substantially from forecasts. Analysts are not expecting surprises though, predicting ending stocks of 980 million bushels for old crop and 1.045 billion bushels for new crop, slightly above USDA’s May new-crop ending stocks estimate of 1.029 billion bushels which is the biggest wheat stockpile since 1987. At the same time further price increase may provoke a short squeeze propelling wheat prices even higher given the big net short position in wheat by managed money. And agricultural commodity prices are getting additional boost from weaker dollar.
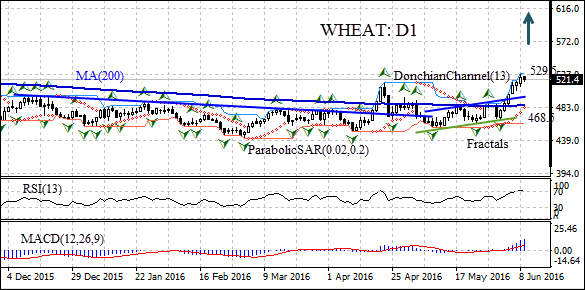
On the daily timeframe WHEAT:D1 has been trending upward after hitting the lowest in six years at the begging of March. The price breached the resistance line in mid April, retraced below the resistance two weeks later and had been trading within an upward channel afterward. It breached above the channel upper boundary on June 3, and is rallying higher. The Donchian channel is tilted upward, which is a bullish signal. The Parabolic indicator has formed a buy signal. The RSI oscillator is in the overbought zone and is edging lower, which is a bearish signal. The MACD indicator is above the signal line and the signal line is above zero level and is edging up, which is also a bullish signal. We expect the bullish momentum will continue after the price breaches and closes above the upper Donchian channel at 529.5. It can be used as an entry point for a pending order to buy. The stop loss can be placed below the last fractal low at 468.5. After placing the pending order the stop loss is to be moved following Parabolic signals. Thus, we are changing the profit/loss ratio to the breakeven point. If the price meets the stop loss level (468.5) without reaching the order (529.5), we recommend cancelling the position: the market sustains internal changes which were not taken into account.
| Position | Buy |
| Buy stop | above 529.5 |
| Stop loss | below 468.5 |
Market Analysis provided by IFCMarkets