By Chris Vermeulen – www.TheGoldAndOilGuy.com
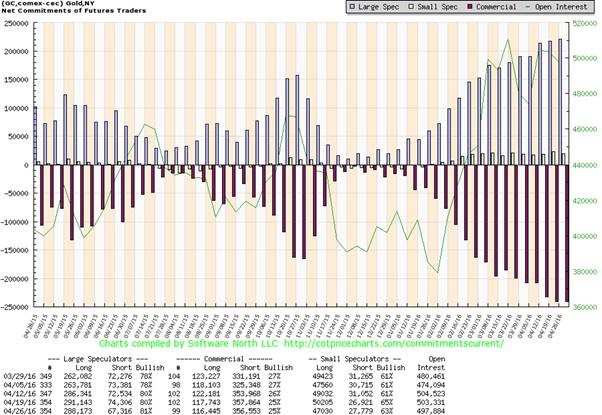
Price of Gold: The activities of the ‘commercial traders’ in the COT data is closely watched by the market participants, as they are believed to be the smartest of the lot. They take deliveries on their bets, unlike the speculators, who have no interest in taking a delivery.
If you have followed the ‘commercial traders’, without paying attention to my proprietary predictive trend and cycle analysis for the price of gold and silver, you would be sitting on large losses, due to their ‘short positions’ which mean they expect price to move lower.
The ‘commercial traders’ ‘short positions’ are currently at record levels which are more than twice of that as compared to last years’ readings. Since the beginning of the second half of February of 2016, the ‘commercials’ have been increasing their short positions during the time that gold was closer to $1220/oz.

Daily Price of Gold Chart and Analysis:
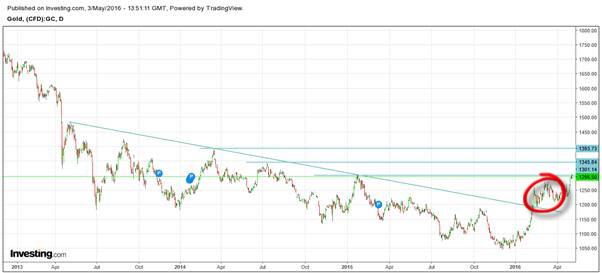
However, if you have followed my recommendation, you would have maintained that once the price of gold crossed the $1190/oz. levels, it was destined to go higher.
Free Reports:
 Get Our Free Metatrader 4 Indicators - Put Our Free MetaTrader 4 Custom Indicators on your charts when you join our Weekly Newsletter
 Get our Weekly Commitment of Traders Reports - See where the biggest traders (Hedge Funds and Commercial Hedgers) are positioned in the futures markets on a weekly basis.
However, the head and shoulder formation which developed after gold broke above the $1190 resistance trend line I did feel it would correct for a few weeks.
Instead, the price of gold did not correct, rather it consolidated with this what looked to be a head and shoulders pattern then broke out to the upside and rallied. Once a bearish pattern fails, it becomes very bullish which is what has happened in this case. I was quick to alert my subscribers to buy as soon as the pattern was broken and turned bullish.
However, the current price of gold at $1300/ oz. could offer some resistance, but the resolution of the trend in due time is going to be very strong. The pattern target of the current move is $1350/oz.

What about the ‘poor man’s gold’, Silver?
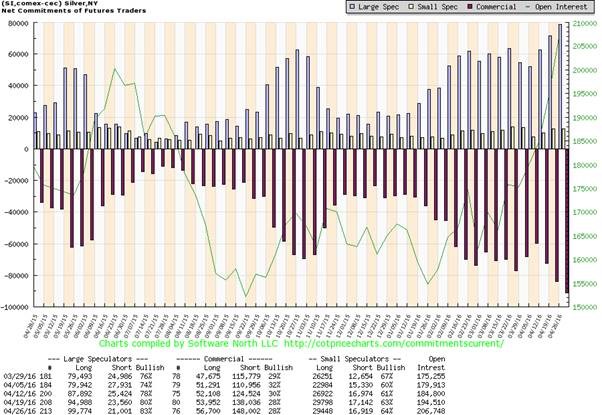
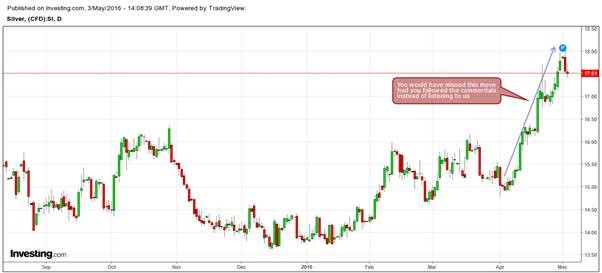
The chart indicates that in the last three weeks of April of 2016, the ‘commercial traders’ have added to their short positions continuously, however, they have been proven wrong once again with the breakout in silver returning 20% during the month of April of 2016.

Although we take note of the ‘commercial positions’, I strongly believe in my analytic models which have provided excellent returns, over many years.
Once above the $16/oz. levels, I have had no doubt that silver was ready for a sharp run-up. Therefore, I will be advising my private subscribers as to when to purchase silver, against the bias of the ‘commercial traders’ and I am confident that my subscribers will reap a windfall when the time is right.

Conclusion – Current Investment Strategy of the Mega-Rich
Do you really want to follow the ‘smart money’? Then follow the billionaires and the big banks as I have been doing. Ray Dalio, the founder of Bridgewater Associates, manages the largest hedge fund, in the world. His fund manages over $160 billion in assets. Today, his fund is bullish on gold. He recently stated “if you don’t own gold there is no sensible reason other than you don’t know history or you don’t know the economics of it”.
Stanley Druckenmiller has been purchasing a large long-term position in gold. He made an average of 30% of an annual return in his fund since 1986. So, what is he buying now?
He has an $880 million position in gold, right now. Do you think you should now be following the ‘really smart money’, today?
Follow the ‘smart money’! Gold is for the long-term investor, well looking forward 3-5 years at least.
Get My Daily Live Price of Gold Market Analysis, Forecast & Trade Alerts:www.TheGoldAndOilGuy.com
Chris Vermeulen