By Money Metals News Service
Federal Reserve officials hinted at a rate hike as soon as next month, but that prospect did little to support the U.S. dollar or hinder precious metals. Gold and silver prices have surged to new highs for the year while the dollar made a new low.
Perhaps markets have already priced in another modest rate hike. Or maybe the markets simply aren’t taking the hint! Fed officials’ constant posturing and innuendo have long been contradictory and unreliable – and the Fed’s economic forecasts have usually been wrong.

One thing is for certain – the metals are getting lots of renewed speculative interest and support from some good looking technical charts. Silver gained more than 16% in April, outperforming gold’s rise of close to 5% – all of which came in the final week of the month.
And both metals closed above key overhead resistance on Friday and are looking strong so far this week. Open interest in silver futures made a new record in last week’s Commitment of Traders (CoT) report. Gold open interest isn’t far behind with more than 500,000 open contracts.
Some speculate the bullion banks, who are increasingly short, would like to orchestrate a price correction. Thus far, however, large sell orders have been sopped up by an overwhelming number of buyers. Anyone selling heavily short into this impressive rally certainly has to be nervous. It’ll be worth watching the CoT report this week to see if there is evidence of the shorts beginning to cover.
Free Reports:
 Get Our Free Metatrader 4 Indicators - Put Our Free MetaTrader 4 Custom Indicators on your charts when you join our Weekly Newsletter
 Get our Weekly Commitment of Traders Reports - See where the biggest traders (Hedge Funds and Commercial Hedgers) are positioned in the futures markets on a weekly basis.
Gold/Silver Ratio Confirming Upturn in Metals Markets
Silver started a bit slow out of the gate in 2016, but it hit its stride in April. The white metal is now up 29% (or $4/oz) since January 1, eclipsing gold’s 22% gain.
Silver outpacing gold is good news for metals bulls, and not just for the obvious reasons. The move is an important signal that we can expect sustained higher prices for both metals.
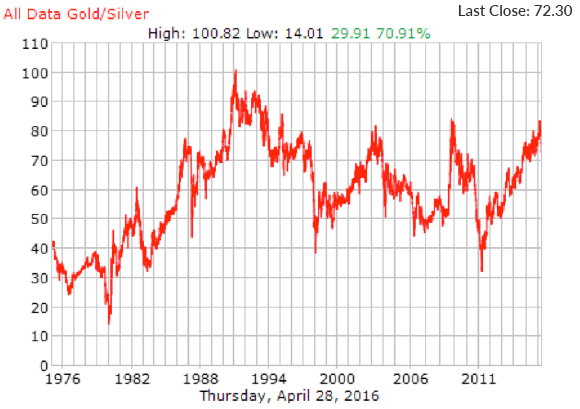
The gold/silver ratio is calculated simply by dividing the gold price by the silver price to see how many ounces of silver it takes to buy one ounce of gold. This ratio has been a good indicator of market turning points. Why? Because silver historically leads the way, either up or down. Some investors questioned the recent rally in metals prices until silver confirmed the move higher by heading to the forefront.

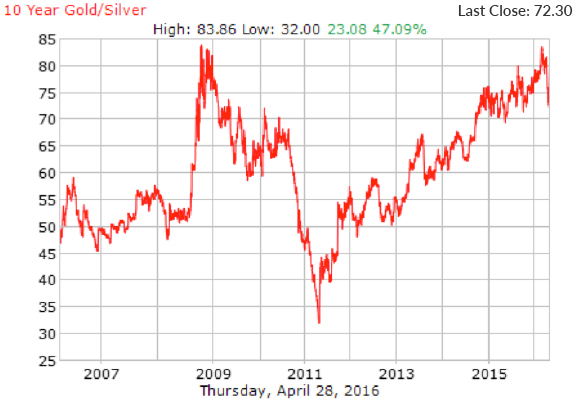
After peaking at 83 in February, the gold/silver ratio has fallen sharply. The good news for metals investors is that the move may be just getting started. The ratio currently sits at just over 72, still in extreme territory.
Furthermore, the last time we saw the ratio as high as we saw it just two months ago was at the end of 2008. That marked the beginning of a spectacular run for the metals, especially silver. Silver went from under $10 an ounce all the way to $48 in less than 30 months, and the gold/silver ratio fell from the low 80s down to 32 by the spring of 2011.

So if history repeats, the ratio could be headed back below 40. In Fact, a powerful bull move could drive the ratio well below 40. If markets revert to the long term average set over the course of centuries, as many expect, we could easily see fewer than 20 ounces of silver needed to buy an ounce of gold.
 The Money Metals News Service provides market news and crisp commentary for investors following the precious metals markets.