By IFCMarkets
The US S&P 500 stock market index has stopped rising ahead of the following Fed meeting which is due this Wednesday at 20:00 СЕТ. The recent weak US economic data erased the chances for the Fed rate hike. The markets price in the 20% chance for the rate hike on the next Fed meeting on June 15. The current low credit rates are a positive factor for the US companies and their stocks. On the other hand, the technical analysis shows the negative divergence in the S&P chart. The situation being what it is, which analysis shall we follow – the technical or fundamental one?
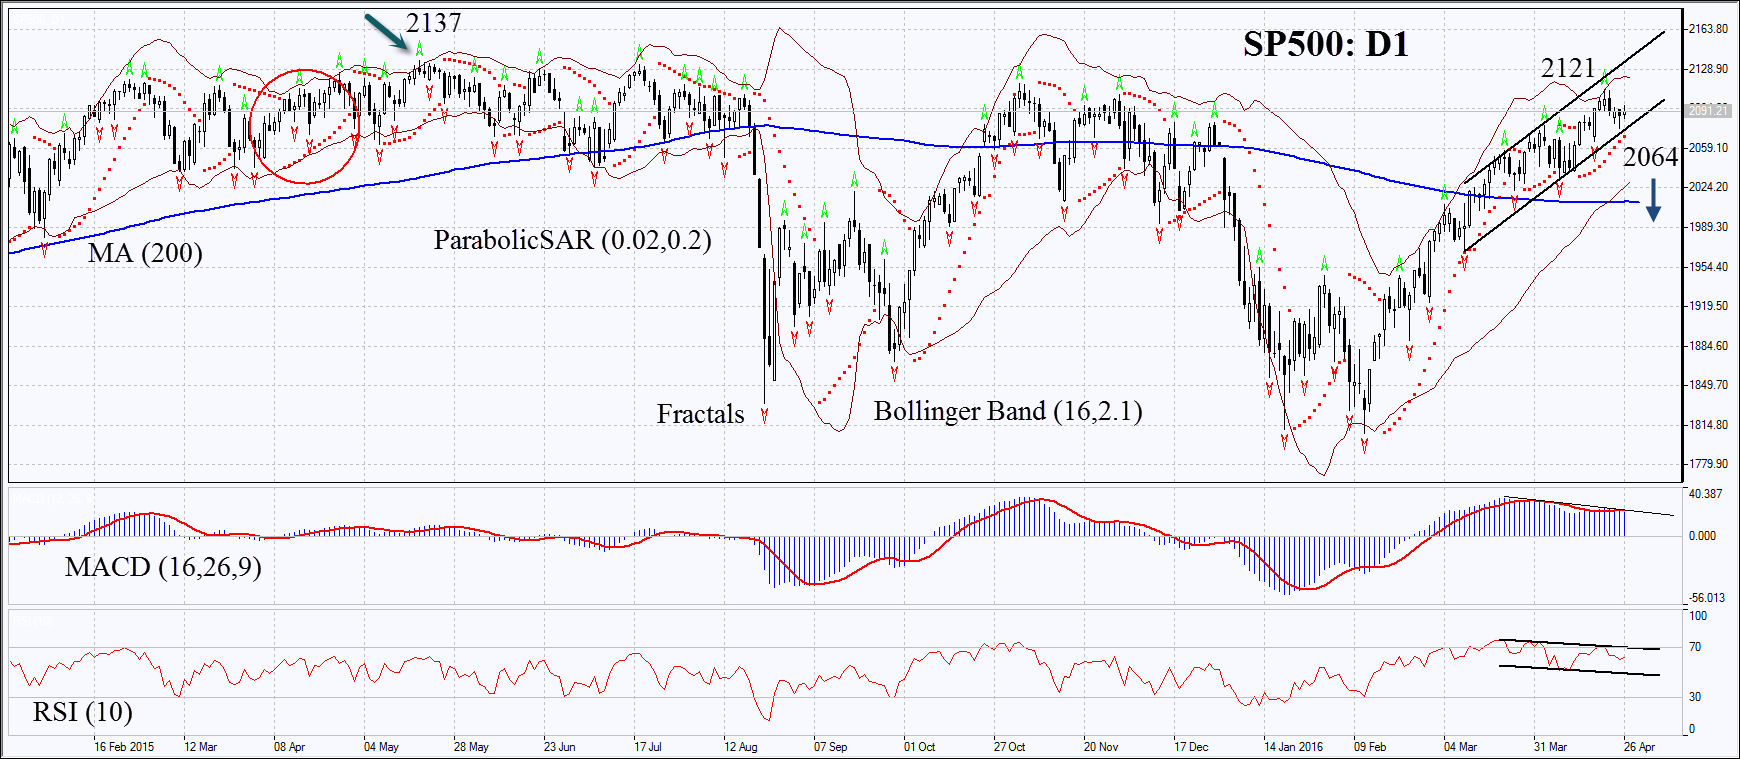
We believe the main negative for the US stock market is the relatively weak state of the US economy and the fact it is overbought compared to the forecasts. Investors expect the total earnings of S&P 500 components to contract by 7.3% in Q1 2016 compared to the same period of 2015. Already 135 companies have posted their earnings so far. Meanwhile, last April S&P 500 was traded at roughly the same levels as now (the period is marked with red circle in the chart). The economic data came out weak on Tuesday. The long-term durable orders rose 0.8% in March which was below their expected rise of 1.9%. They dipped 3% in February which provoked the US Q1 2016 GDP growth to be revised down. Now it is around only 0.1-0.2% which is far below the Q4 2015 advance of 1.4%. Such a weak outlook is partly confirmed by the lower consumer confidence index for April released on Tuesday as well. The official US GDP data for Q1 will be released at 14:30 CET this Thursday and may have a significant effect on the market dynamics.

On the daily chart SP500: D1 is in mid-term uptrend and has come close to the upper boundary of the multi-year flat trend. It is not far from its historical high of 2137 points (marked by the red arrow in the chart). The MACD is giving signal to sell. Parabolic has not reversed downwards yet and its signal may serve as support. RSI has left the overbought zone having formed the negative divergence. It is being below 50. The Bollinger bands have contracted which means lower volatility. The bearish momentum may develop in case S&P 500 index falls below the last fractal low, the Parabolic signal and support of the short-term uptrend at 2064. This level may serve the point of entry. The initial risk-limit may be placed above the Parabolic signal, the last fractal high and Bollinger band at 2121. The most conservative traders may use the historical high of 2137. Having opened the pending order we shall move the stop to the next fractal high following the Parabolic and Bollinger signals. Thus, we are changing the probable profit/loss ratio to the breakeven point. The most risk-averse traders may switch to the 4-hour chart after the trade and place there a stop-loss moving it in the direction of the trade. If the price meets the stop-loss level at 2121 or 2137 without reaching the order at 2064, we recommend cancelling the position: the market sustains internal changes which were not taken into account.
| Position | Sell |
| Sell stop | below 2064 |
| Stop loss | above 2121 or 2137 |
Market Analysis provided by IFCMarkets