By IFCMarkets
Oil prices are rebounding from multi-year lows on prospects of global market rebalancing while the EUR/USD is correcting upward after the European Central Bank’s April meeting. Let’s study the performance of the PCI – BRENT/EUR , which provides the price of one barrel of Brent oil in euros. Will the price continue rising?
Brent crude oil price has been rebounding after hitting multi-year low in January. It has rallied more than 70% since then on the prospect of global demand and supply rebalancing as US output has been slowly declining in recent months. US companies have cut capital expenditures and active rig counts have been declining too. On Wednesday Energy Information Agency data showed that US domestic oil production fell by 15000 barrels to 8.938 million barrels a day last week. US output is down from 9.373 million a year ago and has declined for past seven weeks in a row. Analysts estimate that oil prices will rise without increase in shale oil output until they reach $50 per barrel with further increases inducing resumption of more drilling by shale oil producers. Weak dollar also provides support for oil, and Federal Reserve decided to leave the interest rate unchanged at the conclusion of its April meeting. The statement suggested policy makers were in no hurry to tighten monetary policy further. Federal fund futures traders are pricing in less than 50% probability for a rate hike in June, and equally low likelihood for a second rate hike in December. While US central bank has adopted a contractionary monetary stance the European Central Bank is implementing an expansionary monetary program aimed at stimulating economic growth in euro-zone. At its April 21 meeting the ECB held the rates unchanged but kept the door open for additional easing measures which should limit any possible EUR/USD appreciation. Thus the price of the PCI is expected to rise given the limited scope for EUR/USD appreciation and continued bullish sentiment for Brent oil.

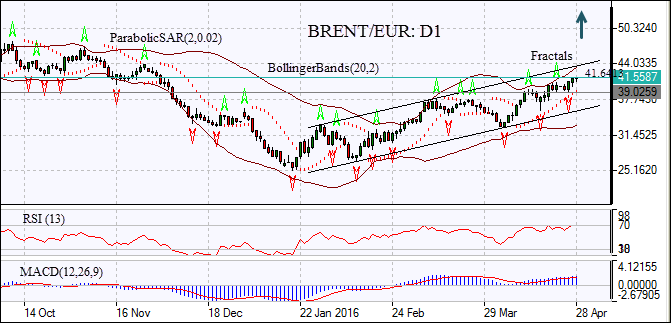
On the daily chart the BRENT/EUR: D1 has been rising since January 20 after Brent crude price started rebounding from multi-year low. The price has risen above the last fractal high and is edging higher. The Bollinger bands are starting to widen, indicating increasing volatility. The Parabolic indicator gives a buy signal. The RSI oscillator has reached the overbought zone. The MACD indicator is above the signal line and the zero level which is also a bullish signal. We expect the bullish momentum will continue and we could go long straight away, or can use the previous session’s high at 46.6413 as an entry point for a pending order to buy. The stop loss can be placed below the last fractal low at 39.0259. After placing the pending order, the stop loss is to be moved to the next fractal low, following Parabolic signals. By doing so, we are changing the probable profit/loss ratio to the breakeven point. If the price meets the stop loss level at 39.0259 without reaching the order, we recommend canceling the position: the market sustains internal changes which were not taken into account.
| Position | Buy |
| Buy stop | above 46.6413 |
| Stop loss | below 39.0259 |
Market Analysis provided by IFCMarkets