By IFCMarkets
Significant economic data were released on Wednesday in Australia – inflation unexpectedly edged lower in Q1 2016. Now market participants assume the RBA may cut the rates on the following meeting scheduled on next Tuesday, May 3. Will the aussie edge lower?
Last week the probability of the rate hike in Australia was only 12%. When the inflation data came out, the chances of such a move surged to 65%. The current RBA rate is 2% but it is expected to fall to 1.75% which may make the Australian dollar less appealing and push it lower. The Q1 2016 inflation was -0.2% in Australia compared to the Q4 2015. It fell to the negative for the first time since 2009 while most investors expected it to be 0.2%. The year-on-year inflation is 1.3%. According to the majority of forecasts, Australian GDP is to increase by 2.6% in 2016 and by 2.9% in 2017. Such high paces may become additional factor for RBA rate cut. Aussie hit a fresh 7-year low in January and then rebounded 15% together with global commodities prices which are the mainstay of Australian export. The producer price index for Q1 will be released in Australia on Friday morning, and the RBA’s representative speech is expected.

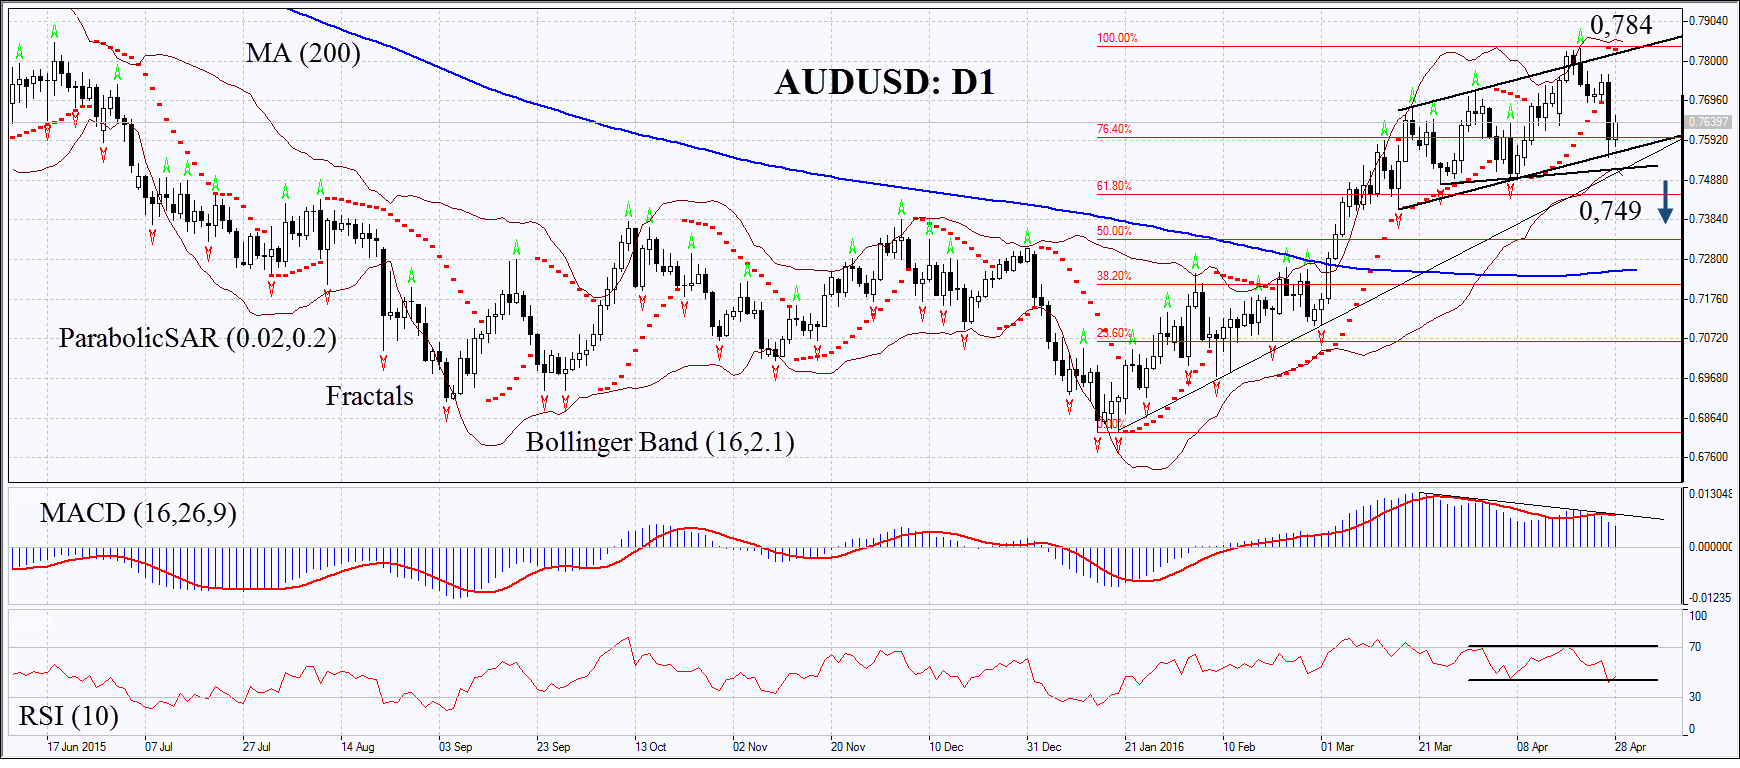
On the daily chart AUDUSD: D1 has approached the support of an uptrend. The MACD and Parabolic indicators give bearish signals. RSI is below 50 and has formed the negative divergence. The Bollinger bands have contracted which means lower volatility, they are tilted downward. The bearish momentum may develop in case the Aussie falls below the last fractal low, the support of an uptrend, the trend lines and the Bollinger band at 0.749. This level may serve the point of entry. The initial risk-limit may be placed above the last fractal high being the 10-month high, the Parabolic signal, upper Bollinger band and resistance of the uptrend at 0.784. Having opened the pending order we shall move the stop to the next fractal high following the Parabolic and Bollinger signals. Thus, we are changing the probable profit/loss ratio to the breakeven point. The most risk-averse traders may switch to the 4-hour chart after the trade and place there a stop-loss moving it in the direction of the trade. If the price meets the stop-loss level at 0.784 without reaching the order at 0.749, we recommend cancelling the position: the market sustains internal changes which were not taken into account.
| Position | Sell |
| Sell stop | below 0.749 |
| Stop loss | above 0.784 |
Market Analysis provided by IFCMarkets