By IFCMarkets
Gold fell in price after the Fed Chair Janet Yellen’s comments there is no need to hurry with further interest rate hikes. Mid last December Fed raised the rates from 0.125% to 0.375% for the first time in 9 years. The reaction of the precious metals market was uncharacteristic: the precious metals prices are edging down together with the US dollar index while they are usually negatively correlated. Will the gold prices continue retreating?
The Fed funds futures price in the 46% of the interest rate hike in July, down from 51% on Monday before the Janet Yellen’s comments. The probability of the September rate hike fell to 56% from 63% which triggered the global stock markets rally. Some investors may transfer their funds from gold into shares. The additional negative for precious metals were the unofficial US labour market data from ADP for March. Employment rose much more than expected. If the positive trend is supported by the official data on Friday, the chances for the US Fed interest rate hike may increase. The 16% surge of gold prices in Q1 2016 was the highest since Q3 1986. Such an explosive growth doesn’t rule out the possibility of the technical downward correction. On Tuesday the stocks of the world major gold-backed SPDR Gold Shares ETF contracted by 3.3 tonnes for the first time in recent 2 weeks.

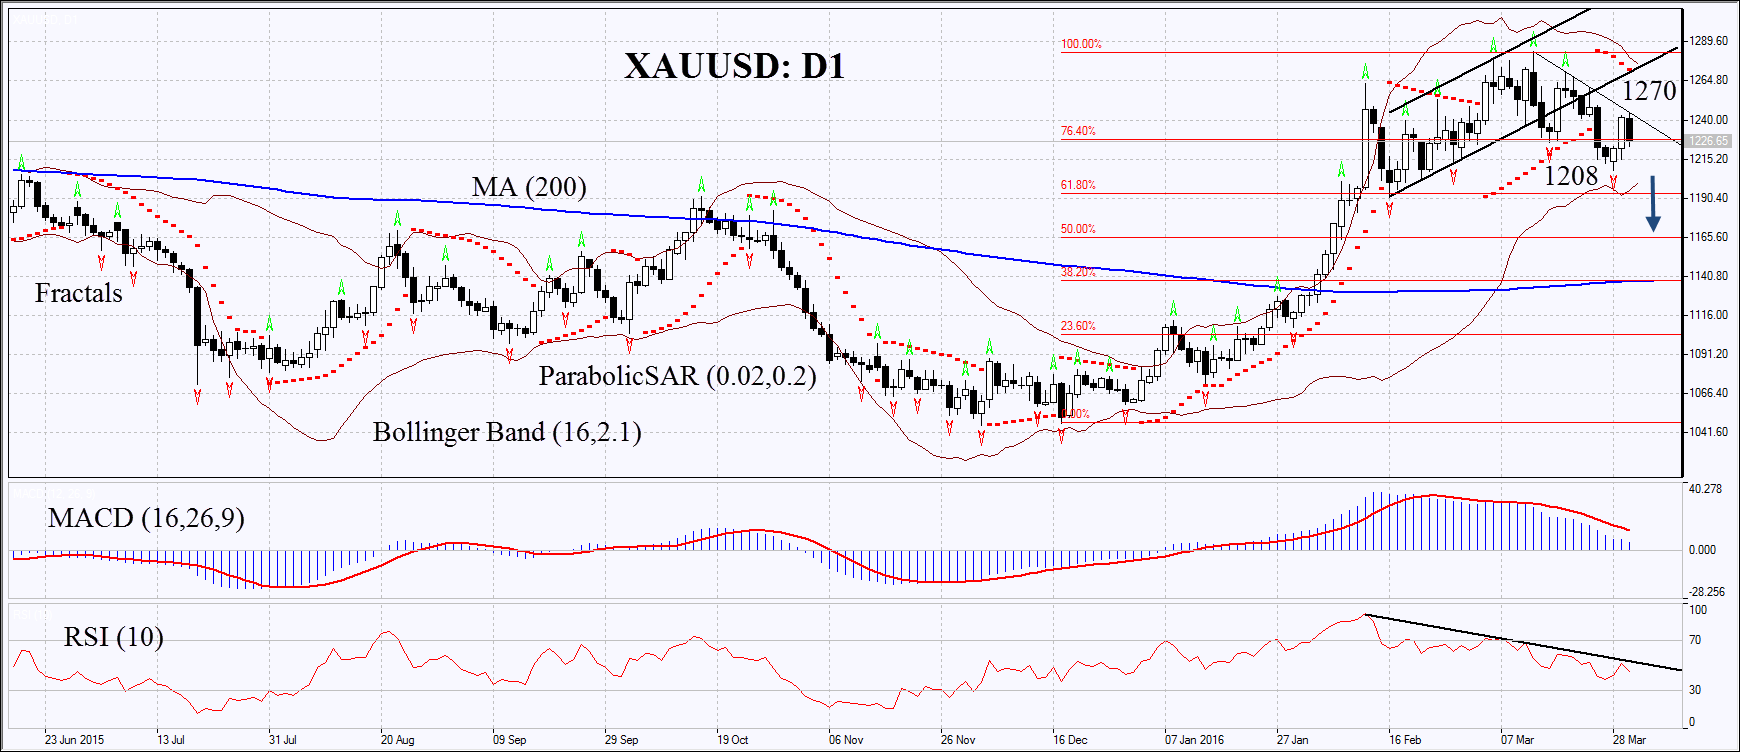
On the daily chart XAUUSD: D1 has stopped moving sideways and began correcting down from the year high. The MACD and Parabolic indicators give bearish signals. RSI has formed negative divergence and fell below 50. The Bollinger bands have contracted which means lower volatility. The bearish momentum may develop in case the gold price dips below the last fractal low at 1208. This level may serve the point of entry. The initial risk-limit may be placed above the Parabolic signal, Bollinger band and the last fractal high at 1270. Having opened the pending order we shall move the stop to the next fractal high following the Parabolic and Bollinger signals. Thus, we are changing the probable profit/loss ratio to the breakeven point. The most risk-averse traders may switch to the 4-hour chart after the trade and place there a stop-loss moving it in the direction of the trade. If the price meets the stop-loss level at 1270 without reaching the order at 1208, we recommend cancelling the position: the market sustains internal changes which were not taken into account.
| Позиция | Продажа |
| Sell stop | ниже 1208 |
| Stop loss | выше 1270 |
Market Analysis provided by IFCMarkets