By IFCMarkets
China reported on Friday it increased the share of gold in its reserves by 19 tonnes to 1762 tonnes in December. They increased by 21 tonnes in November and further by 45 tonnes since August to October. Meanwhile, the gross official reserves of China fell to the lowest since 2012 at $3.4bn at the end of this year. Market participants suppose the Bank of China decided to increase the share of gold in its reserves which is now around 1%. Will it support the gold prices?
China is not alone to acquire gold. The major New York based SPDR Gold Shares fund stated on Wednesday the net volume of its gold stock increased by 11.7 tonnes. Investors acquire gold as a safe haven asset given the world stock market stagnation and low rates. On Friday the gold prices found support in the news that Chicago and St. Louis Reserve Banks were concerned with the modest economic expansion in the US. The data showed the December retail sales fell 0.1% while the industrial production fell 0.4% in the US. Taken altogether, these factors pushed the US dollar, which is negatively correlated with gold, lower.
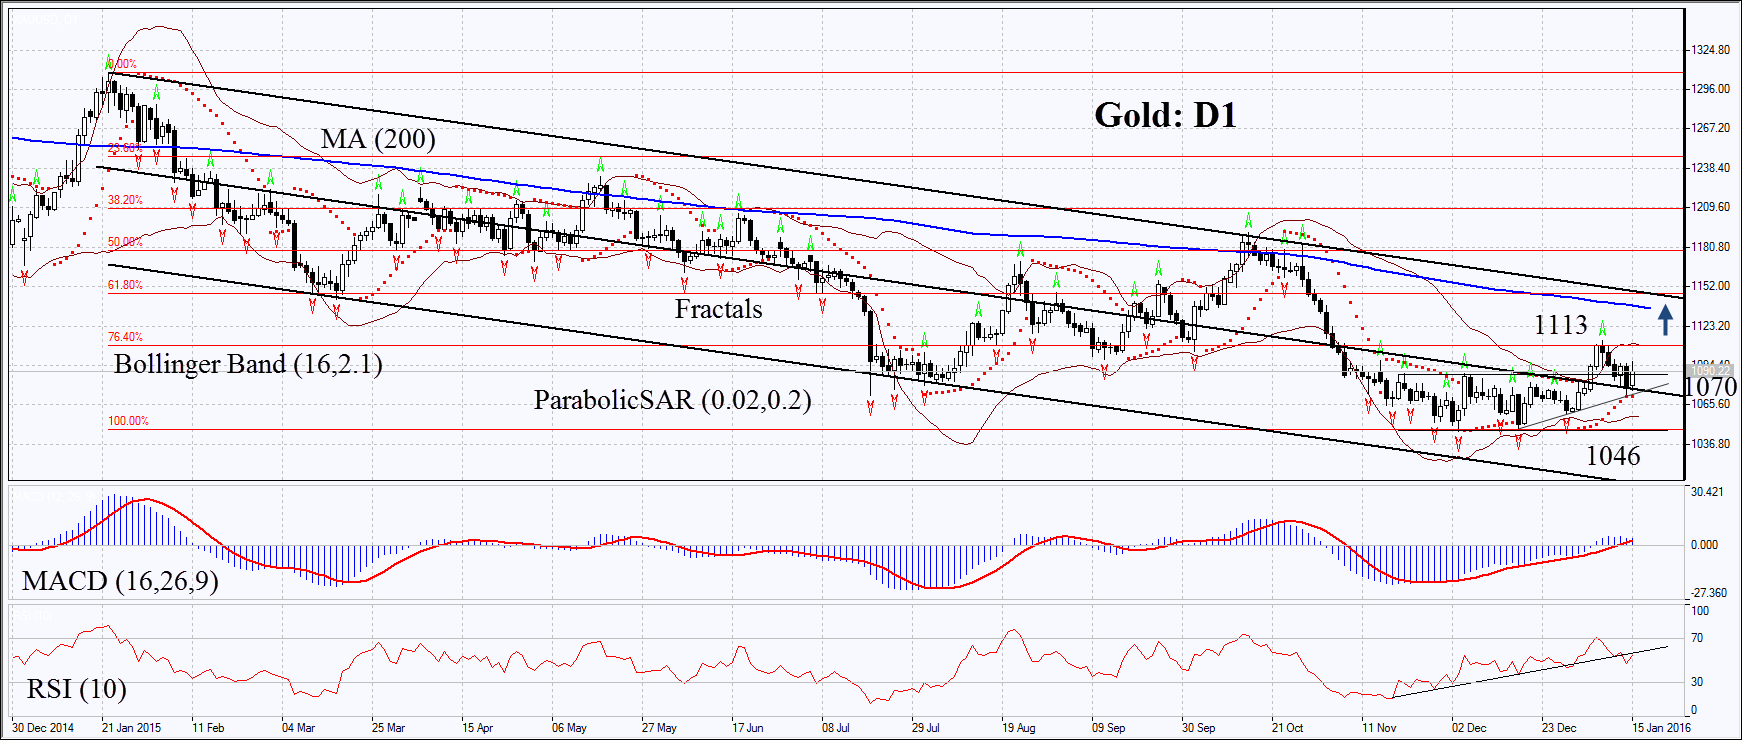
On the daily chart XAUUSD: D1 has passed into the uptrend, running to the first Fibonacci level and correcting down from it. Parabolic indicator and MACD give signals to buy. The Bollinger bands have contracted which may mean lower volatility. RSI has surpassed the level of 50 but has not yet reached the overbought zone, no divergence. The bullish momentum may develop in case the gold prices surpass the first Fibonacci level, the Bollinger band and the last fractal high at 1113. This level may serve the point of entry. The initial risk-limit may be placed below the Parabolic signal at 1070 or below the 5-year low at 1046. Having opened the pending order we shall move the stop to the next fractal low following the Bollinger and Parabolic signals. Thus, we are changing the probable profit/loss ratio to the breakeven point. The most risk-averse traders may switch to the 4-hour chart after the trade and place there a stop-loss moving it in the direction of the trade. If the price meets the stop-loss level at 1070 or 1046 without reaching the order at 1113, we recommend cancelling the position: the market sustains internal changes which were not taken into account.
| Position | Buy |
| Buy stop | above 1113 |
| Stop loss | below 1070 or 1046 |
Market Analysis provided by IFCMarkets