By IFCMarkets
On Friday the US stocks continued falling which is quite abnormal. S&P 500 lost 6% which is its weakest performance for the first post New Year five days since 1929 and Dow Jones lost 6.2% hitting a new record fall since 1897. The Nasdaq weekly decline is 7.3%. All-in-all, the US macroeconomic indicators seem to be quite stable. This supports the US dollar and increases the probability of the further Fed rate hike. The US nonfarm payrolls came out on Friday being a cut above the expectations. The December unemployment remains at the 7 ½ year low of 5%. The rate hike may increase the corporate loan interests thus reducing their income. The second reason for US stock indices slump is the China’s economic slowdown that jeopardizes global economic expansion. Soon the financial statements for Q4 2015 will be published. The gross corporate earnings of S&P 500 components are expected to fall by 4.2%. This is below the last week expectations of 3.7% decline. On October 1 the earnings increase of 1.1% was expected.
Today and tomorrow no significant macroeconomic data are expected in US which may support the stock market. We believe the most important data will come out on January 15 – the December retail sales. The tentative outlook is negative for dollar.

European stocks have opened with gap down today amid tumbling stock market in China but rebounded later. The People’s Bank of China set the mid-point for the yuan higher for the second time after the 8-year depreciation. The move slightly calmed down the investors. The pan-European Stoxx Europe 600 advanced 0.4%. Its fall of 6.7% in the first week is the most severe in 4 years. Volkswagen, Daimler, BMW stocks are surprisingly the top performers among the German DAX 30 index components with no particular drivers for such an increase. Previously, they were the bottom performers. Today and tomorrow no significant macroeconomic data are expected in Eurozone.

Japanese yen is edging down today amid stronger yuan. Previously, the yen strengthened to the highest since last August. Today in Japan is a day-off due to the Coming of Age Day holiday. Tomorrow at 0:50 СЕТ the following macroeconomic data will be released: December trade balance and current account balance. At 6:00 СЕТ the December Consumer confidence index and at 7:00 CET the Eco Watchers indicators will be released.
The World Bank downgraded its global economic growth forecast for 2016 from 3.3% in June to 2.9%. In our opinion, this is not bad at all. Such a forecast may support the commodity futures growth. The World Bank revised down its forecast only by 0.4 percentage points while the oil prices fell almost twice since June 2015.
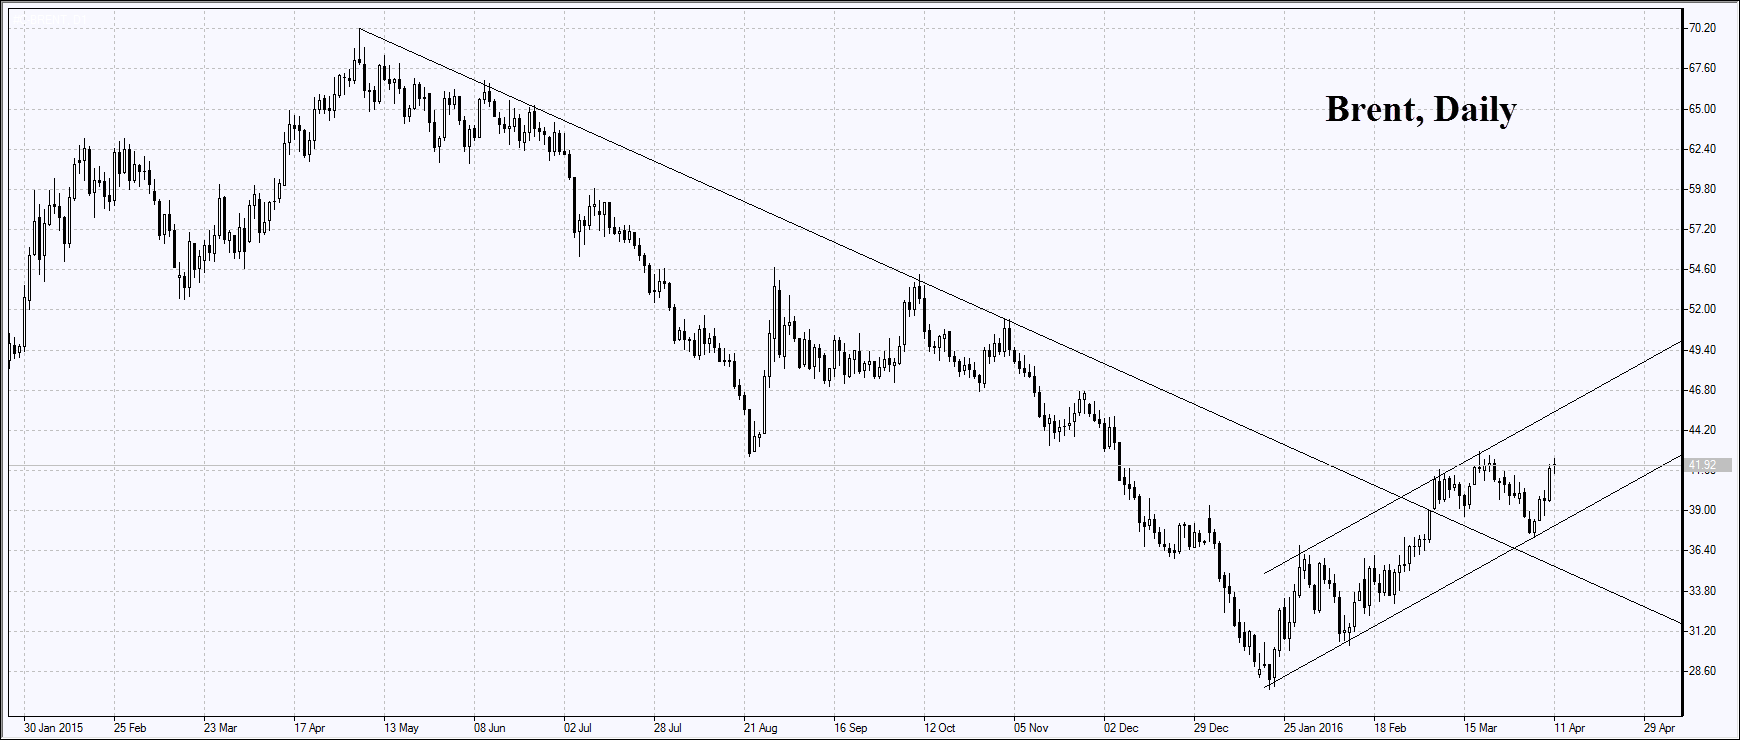
It is hard to tell how much the oil prices may fall for them currently being at 12-year lows. The active oil rigs count in the US fell by 20 units to 516, the lowest since April 2010, according to Baker Hughes. In the same period of last year 1421 oil rigs were active in the US with Brent prices slightly below $52 a barrel. The rigs count fell for the first time since 2002 and the fall is the biggest since 1988. Some investors await the outlook for US oil production to be revised down this year which may support its prices. Let us remind you that the US oil production is expected to fall by 570 thousand barrels a day to 8.76 mln, compared to 2015 volumes.
Gold edges further up amid risks of Chinese and global economic slowdown. China will have difficulties with growth of more than 6.5% in 2016-2020, according to China Securities Journal. The official pace of economic expansion for this year is 6.7%.
This overview has an informative and tutorial character and is published for free. All the data, included in the overview, are received from public sources, recognized as more or less reliable. Moreover, there is no guarantee that the indicated information is full and precise. Overviews are not updated. The whole information in each overview, including opinion, indicators, charts and anything else, is provided only for familiarization purposes and is not financial advice or а recommendation. The whole text and its any part, as well as the charts cannot be considered as an offer to make a deal with any asset. IFC Markets and its employees under any circumstances are not liable for any action taken by someone else during or after reading the overview.
Market Analysis provided by IFCMarkets