By IFCMarkets
Last December the Canadian dollar rate reached the 11-year high against the US currency which means its severe weakening. Nevertheless, the chart stopped moving upwards. Fossil fuels are the heart of Canadian export. Their current price is quite stable. Will it support the Canadian dollar? On the chart the CAD strengthening will look as the fall of USDCAD.
On December 18, 2015 the Canadian dollar fell to the lowest in 11 years at C$1,4003. It is strongly dependent on the global oil prices and fell almost one third since 2014 and 16% since the start of 2015. Now oil has stabilized amid the Iran and Saudi Arabia tensions which may strengthen the Canadian dollar (the downward correction on the chart). On January 7, 2016 the Governor of the Bank of Canada Stephen Poloz will speak and may give some clues on the further rate changes that is now at 0.5%. Previously most investors expected the lower rates which would have pushed the Canadian dollar lower and mean the growth on the USDCAD chart. Investors’ confidence evaporated when the US Fed hiked the rates. The next Bank of Canada meeting is due on January 20. This week the important data on the Canada’s external trade in November will come out on Wednesday and the labour market report will be released on Friday. We believe their tentative outlook is positive for the Canadian dollar and may push the Canadian dollar lower in case the expectations will prove true.
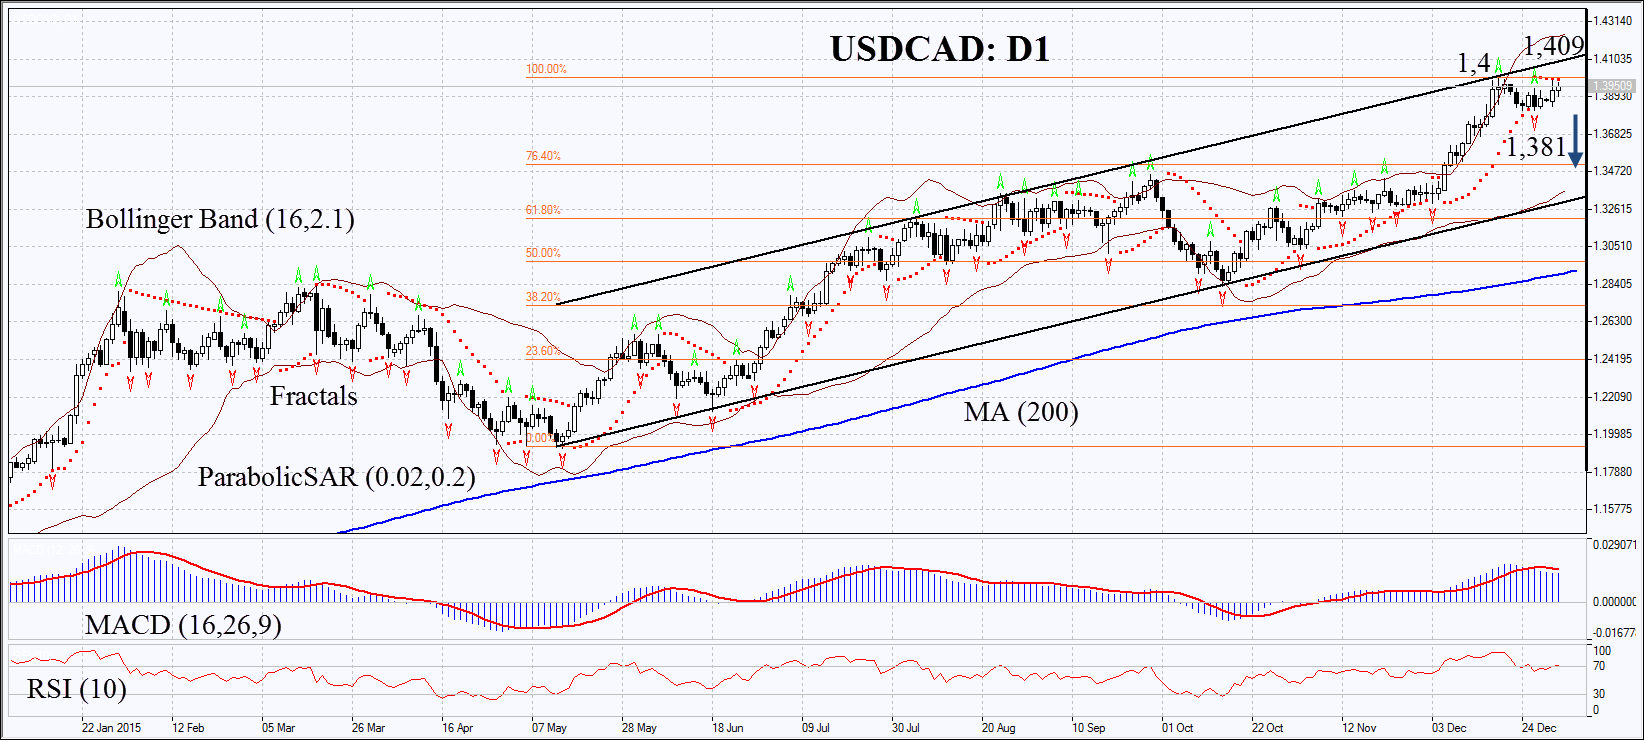
On the daily chart USDCAD: D1 is in the uptrend. In the mid-December it has reached its upper boundary and failed to break it through. The Parabolic and MACD indicators give sell signals. The Bollinger bands have widened a lot which may mean high volatility. RSI has been in the overbought zone for a month now, no divergence. The bearish momentum may develop in case USDCAD surpasses the last fractal low at 1.381. This level may serve the point of entry. The initial risk-limit may be placed above the Parabolic signal and the second fractal high being the 11-year high at 1.4. The most risk-averse traders may place the stop above the resistance of the price channel at 1.409. Having opened the pending order we shall move the stop to the next fractal high following the Bollinger and Parabolic signals. Thus, we are changing the probable profit/loss ratio to the breakeven point. The most risk-averse traders may switch to the 4-hour chart after the trade and place there a stop-loss moving it in the direction of the trade. If the price meets the stop-loss level at 1.4 or 1.409 without reaching the order at 1.381, we recommend cancelling the position: the market sustains internal changes which were not taken into account.
| Position | Sell |
| Sell stop | below 1.381 |
| Stop loss | above 1.4 or 1.409 |
Market Analysis provided by IFCMarkets