By IFCMarkets
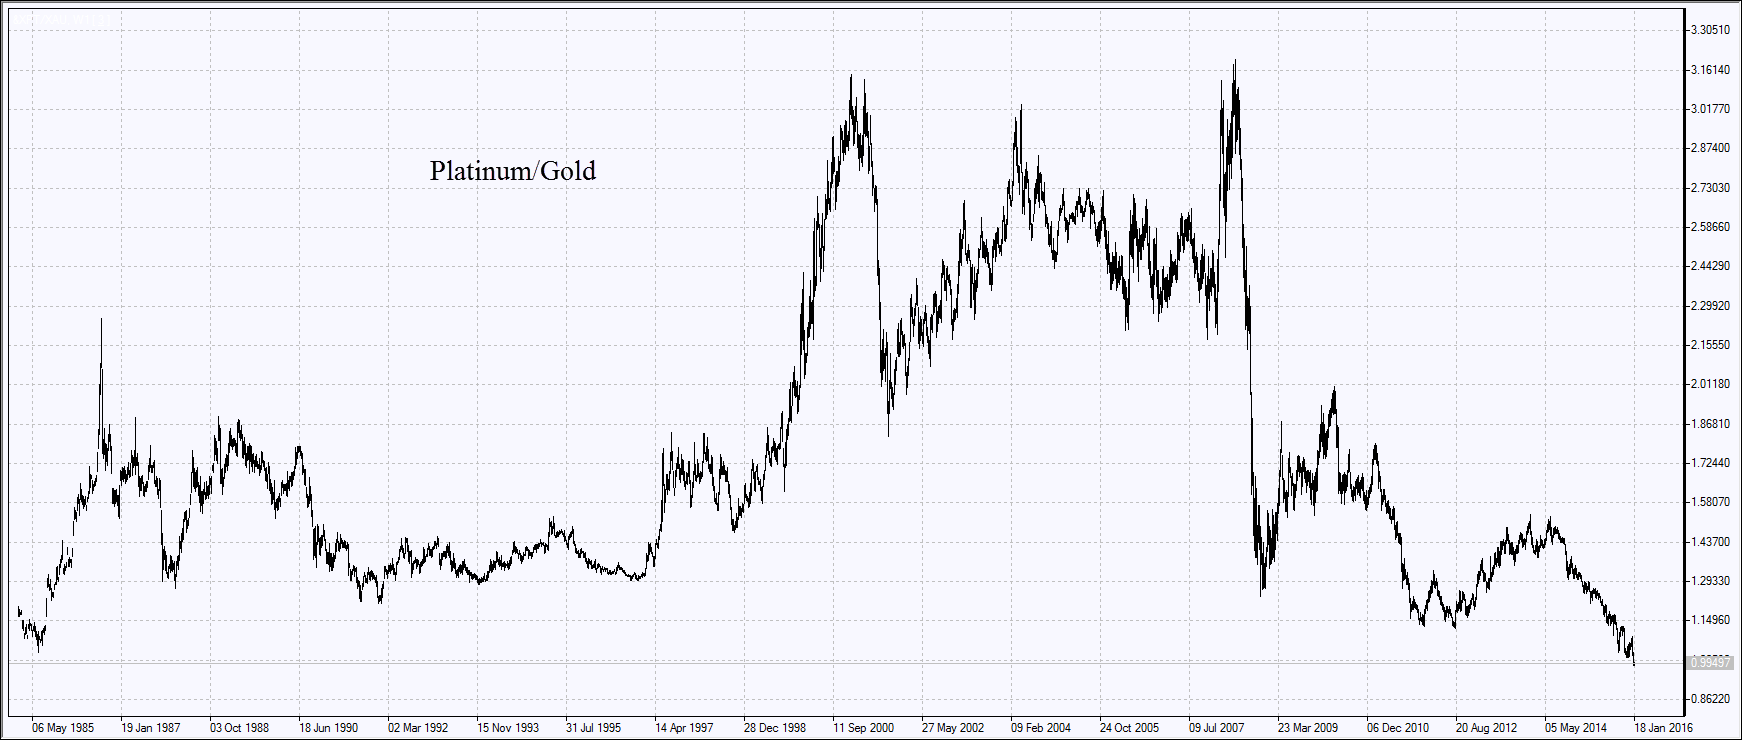
Platinum has become 35% cheaper in the last 12 months while gold lost only 15%. The gold could have found support in its purchases by central banks all over the world that are aiming at increasing the gold share in their reserves. In this context platinum is not less attractive than the gold but is less popular due to the higher volatility. As a result, the ratio of platinum to gold is currently at its lowest since 1984. Can the platinum prices correct upwards?
China has imported 9 tonnes of platinum in November 2015 which is 56% more than in October and is 47% more than in November 2014. Due to such an increase in activity the premium to this metal edged up 8.2% in China compared to its price in London. It has been growing smoothly throughout the 2015 starting in January when the premium was minimal at 5.6%. The purchases of platinum may continue amid the fall of its prices to the 7-year lows at the start of 2016. HSBC bank forecasts its prices will edge up to $1005 an ounce this year and to $1195 an ounce in 2017. Gold prices may advance to $1205 and $1300 an ounce in 2016 and 2017 respectively. In the more long-term period, HSBC sees the platinum prices at $1450 an ounce.
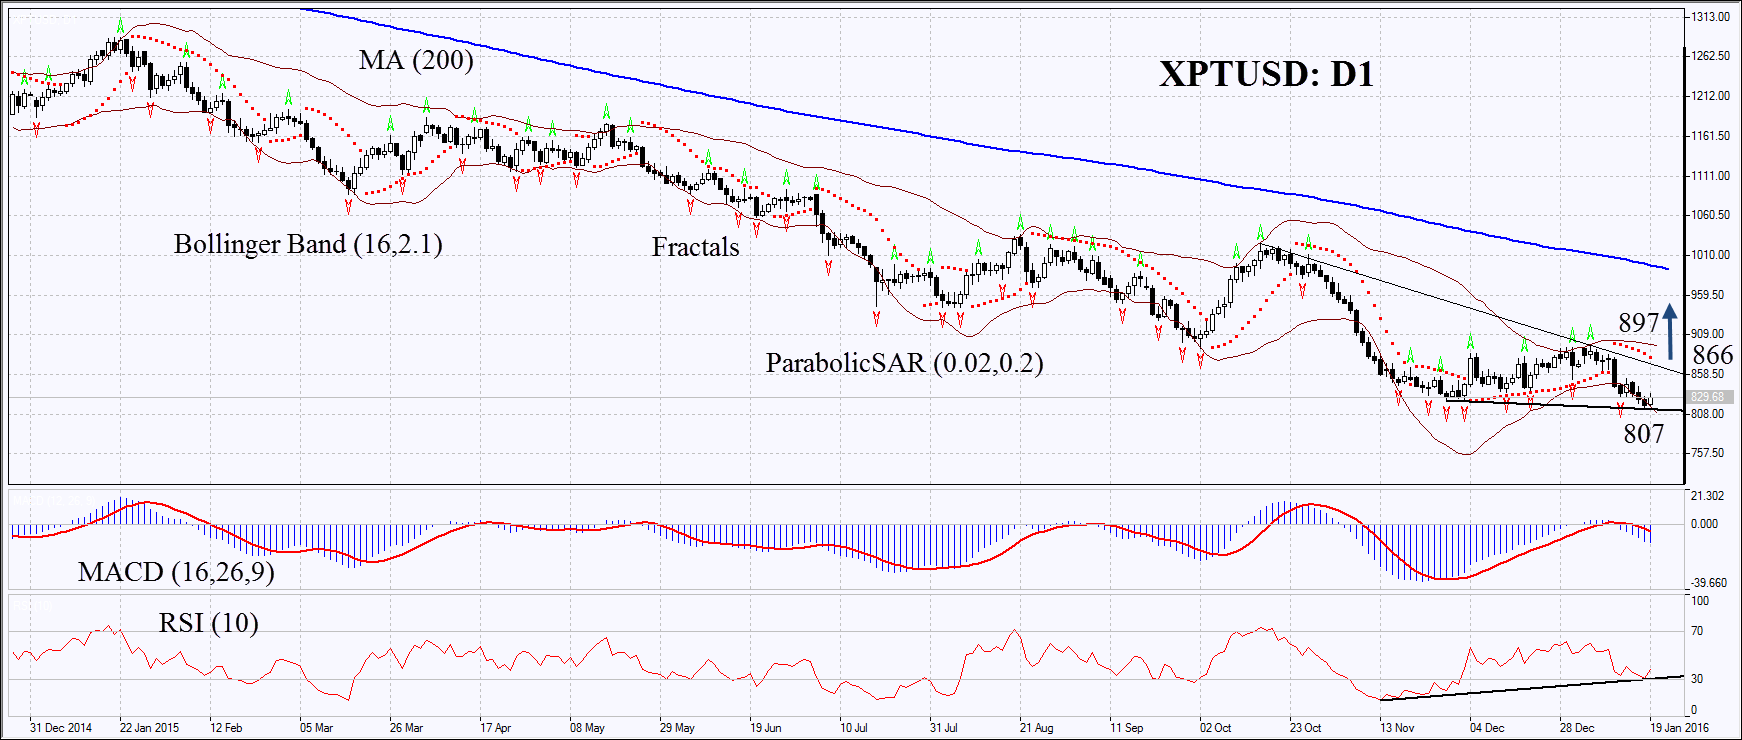
On the daily chart XPTUSD: D1 is in the long term downtrend. Parabolic and MACD indicators give sell signals. RSI is in uptrend close to the oversold zone and have formed the positive divergence. The Bollinger bands have started widening which means higher volatility. The bullish momentum may continue in case platinum surpasses the resistance of the downtrend at 866. This level may serve the point of entry. The most risk-averse traders may wait for surpassing the last fractal high and the Bollinger and Parabolic signals at 897. The initial risk-limit may be placed below the 7-year low and the lower Bollinger band at 807. Having opened the pending order we shall move the stop to the next fractal low following the Parabolic and Bollinger signals. Thus, we are changing the probable profit/loss ratio to the breakeven point. The most risk-averse traders may switch to the 4-hour chart after the trade and place there a stop-loss moving it in the direction of the trade. If the price meets the stop-loss level at 807 without reaching the order at 866 or 897, we recommend cancelling the position: the market sustains internal changes which were not taken into account.
| Position | Buy |
| Buy stop | above 866 or 897 |
| Stop loss | below 807 |
Market Analysis provided by IFCMarkets