By IFCMarkets
Commerzbank, the second-largest bank in Germany, decided to pay out the dividends of 0.2 euro per share for the first time since 2007. The bank’s net earnings increased 62.5% in 9 months of 2015, compared to the same period of last year, to 853mln euros. According to the current market prices, the dividend yield may reach 2%. The record date is not announced yet but it is usually scheduled on February-March. Will the Commerzbank stocks continue to increase in price?
Since the start of the present year the bank’s stocks have lost 4% of their value while the DAX index containing those stocks among its components, climbed 11.6%. We believe the Commerzbank stocks are underestimated. Their P/B ratio (price-to-book ratio) is 0.45 which is almost twice less than in other comparable European banks (0.87). The delayed growth was partly caused by the news that the Commerzbank CEO Martin Blessing is expected to quit next October. The name of his successor is not yet unveiled but will be soon.
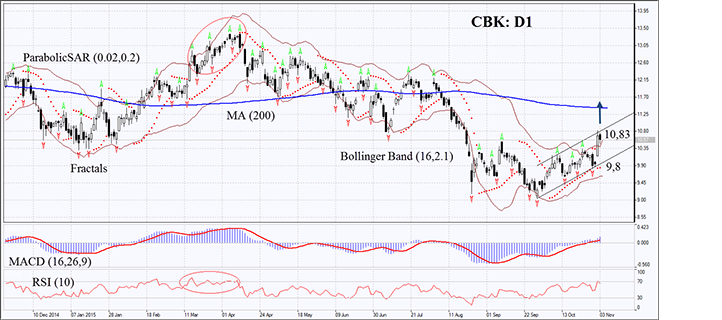
On the daily chart the CBK: D1 is in uptrend but still below its 200-day moving average. The Parabolic and MACD indicators give buy signals. The RSI is on rise but have not yet reached the overbought zone. The divergence is not detected. The Bollinger bands are widening which may mean higher volatility. They are tilted upwards. Two last candles are formed above the Bollinger bands which may be an additional signal to buy. The bullish trend may develop in case the Commerzbank stocks surpass their high of November 2 when the dividend payment was announced pushing the stocks up to 10.83. This level may serve the point of entry. The initial risk-limit may be placed below the trend line and two fractal lows at 9.8. Having opened the pending order we shall move the stop to the next fractal low following the Parabolic signal. Thus, we are changing the probable profit/loss ratio to the breakeven point. The most risk-averse traders may switch to the 4-hour chart after the trade and place there a stop-loss moving it in the direction of the trade. If the price meets the stop-loss level at 10.83 without reaching the order at 9.8, we recommend cancelling the position: the market sustains internal changes which were not taken into account.
| Position | Buy |
| Buy stop | above 10,83 |
| Stop loss | below 9,8 |
Market Analysis provided by IFCMarkets