By IFCMarkets
The ruble-denominated Brent oil chart has significantly diverged once again from its 200-day moving average line. Previously it returned to it. Last time, late October, it failed to touch the average line but experienced almost a week of steady growth. Now it has reversed up again. Will the uptrend continue?
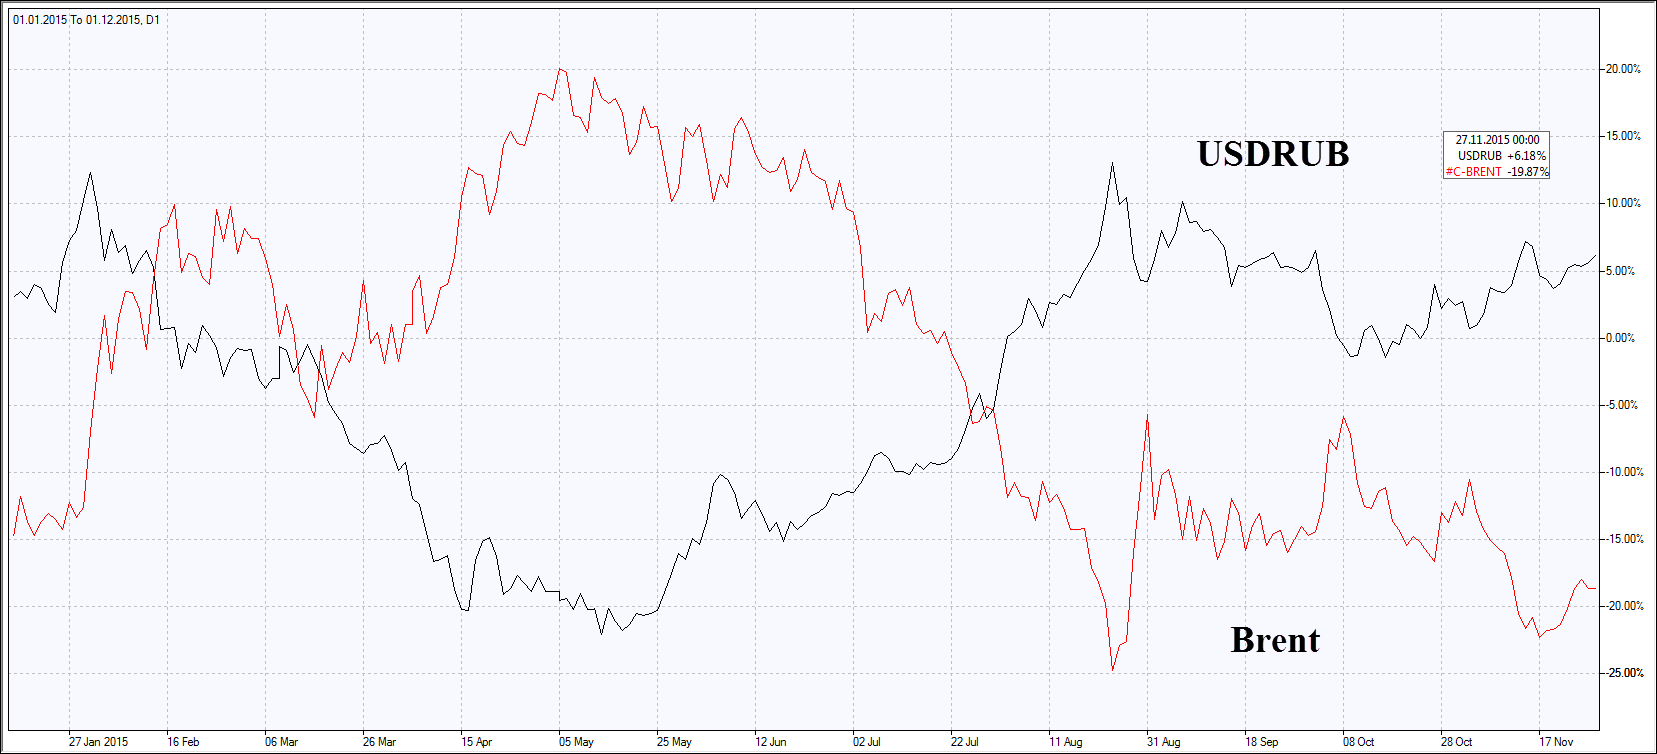
The proportion of fuel and energy goods in the Russian export is quite high amounting to 65%, according to the Federal Customs Service of Russia. This explains the strong inverse correlation of the Russian ruble and the global oil prices. Cheaper oil makes ruble weaker against the US dollar so the ruble-denominated Brent oil chart tends to fluctuate around its average line. The chart of the ruble and oil percentage change illustrates their inverse correlation. Since early 2015 the oil has lost in price much more than the ruble as ruble was mainly devaluated in 2014. The Russian currency is currently supported by the slight economic growth and the moves of the Central Bank. In October the Russian GDP advanced 0.1% being positive for the 4th consecutive month. In January-October this year the GDP lost 3.7% which is slightly above the slump of 4.1% in the first six months. On December 14th the Central Bank of Russia will resume for one year the currency REPO auctions that were suspended in June. In our opinion, the move may considerably improve the currency liquidity and support the ruble. For the instrument in question the mentioned factors are negative and may limit its growth. We believe they have already detained the Brent_RUB growth to the 200-day average line. Now the background is more solid for such a case. On December the 4th the next OPEC meeting will take place which can result in some measures to support the global oil prices. Their increase is positive for Brent_RUB.
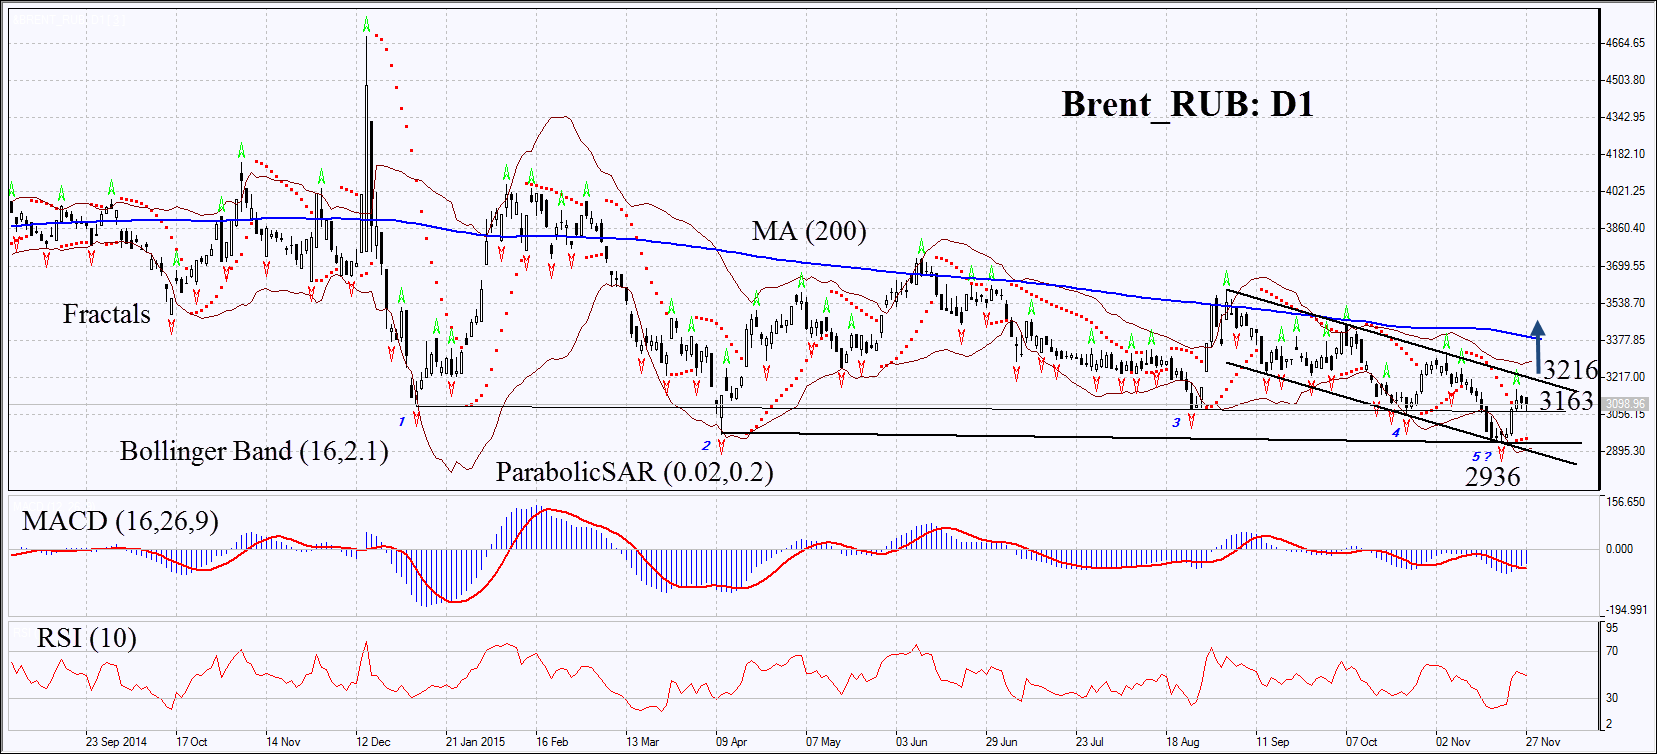
On the daily chart the &Brent_RUB: D1 is in the downtrend for three months. Two weeks ago is began to correct up from its lower boundary. The Parabolic indicator and MACD have formed the buy signals. RSI is neutral slightly below 50, no divergence. The Bollinger bands have contracted which may mean lower volatility. They are tilted upwards. The bullish momentum may develop in case the personal composite instrument surpasses the last fractal at 3163. This level may serve the point of entry. The most risk-averse traders may wait for the break through the upper boundary of the downtrend at 3216. The initial risk-limit may be placed below the Parabolic signal and the last fractal low at 2936. Having opened the pending order we shall move the stop to the next fractal low following the Parabolic and Bollinger signals. Thus, we are changing the probable profit/loss ratio to the breakeven point. If the price meets the stop-loss level at 2936 without reaching the order at 3163 or 3216 we recommend cancelling the position: the market sustains internal changes which were not taken into account.
| Position | Buy |
| Buy stop | above 3163 or 3216 |
| Stop loss | below 2936 |
Market Analysis provided by IFCMarkets