By IFCMarkets
The Australian dollar is edging up due to the strong labour market data for October released on November 12. On Friday the probability, that the Bank of Australia will cut the rate from the current 2%, fell to 30% from 50% at the beginning of the week. Will the Aussie continue its way up?
In October the Australian payroll increased by 58.6 thousand which is much more than the expected 15 thousand. The unemployment fell from 6.2% to the 5-month low of 5.9%. Now the markets expect the GDP growth to accelerate. In the 2nd quarter it was 2% while the normal rate for Australia is 3-3.25%. The tourism helped to improve the economy. This September the number of tourists from China surpassed the last year’s level by 22%, from India by 15% and from Malaysia by 10%. The Australia’s GDP will be released on December 2 while on December 1 the Reserve bank has a meeting. The main risk for the Aussie is the falling global commodities prices. Australian economy has been growing incessantly since 1992 despite all global economic crises. The main Australian export goods are the iron ore, coal, natural gas, non-ferrous metals and farm livestock meat. The principal purchasers are China, Japan and South Korea.
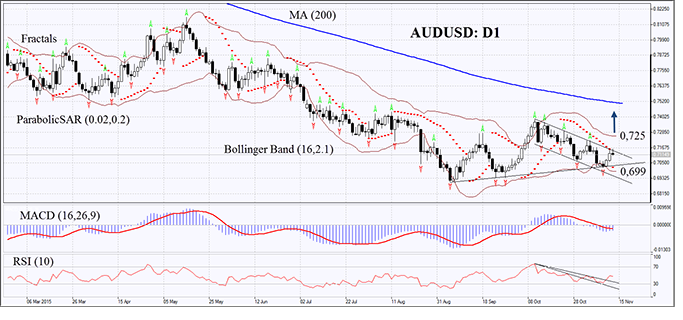
On the daily chart AUDUSD: D1 has come close to the resistance of the downtrend. Early in September it hit the low since 2009 but has not yet managed to break this level. The Australian dollar is below its 200-day moving average. The Parabolic indicator has formed the buy signal while MACD still gives sell signal. RSI is neutral below 50, no divergence. The Bollinger bands have contracted which may mean lower volatility. The bullish trend is possible if AUDUSD surpasses the last fractal high and upper Bollinger band at 0.725. This level may serve the point of entry. The initial risk-limit may be placed below the last fractal low, Parabolic signal and Bollinger band at 0.699. Having opened the pending order we shall move the stop to the next fractal low following the Bollinger and Parabolic signals. Thus, we are changing the probable profit/loss ratio to the breakeven point. The most risk-averse traders may switch to the 4-hour chart after the trade and place there a stop-loss moving it in the direction of the trade. If the price meets the stop-loss level at 0.699 without reaching the order at 0.725, we recommend cancelling the position: the market sustains internal changes which were not taken into account.
| Position | Buy |
| Buy stop | above 0,725 |
| Stop loss | below 0,699 |
Market Analysis provided by IFCMarkets