By IFCMarkets
Canadian elections result in new governing party
The parliamentary elections took place in Canada with the opposition Liberal Party winning the majority government. Now its leader Justin Trudeau will replace the Conservative prime minister Steven Harper who has been holding office for 9 years. The news made the Canadian dollar stronger. For how long is this strengthening likely to continue?
Justin is the son of the former Canadian prime minister Pierre Trudeau who is view as the “father of modern Canada”. He has been leading the government for 15 years in 70s and 80s. Investors assume that the current power shift can improve the economic environment in Canada. This week on October 21 at 16:00 CET the next Bank of Canada meeting will take place. The interest rate at 0.5% is not expected to change but investors are waiting for the clues on the future monetary policy. On October 22 the August retail sales will be released and on October 23 the September inflation comes out. In our opinion, the outlook for USDCAD pair is negative. Nevertheless, the political statements from the new country’s leadership may be even more important for the currency movements. The Conservative Party has been in power for 9 years cutting consistently interest rates. As a result, the Canadian dollar slumped to its low in 11 years. On the chart its weakening is seen as the rise. The market participants concede the Liberal Party can alter the monetary policy. Their chances of winning were quite high and recent weeks the Canadian dollar was strengthening on expectations. In theory, the trend is likely to continue due to the power shift.

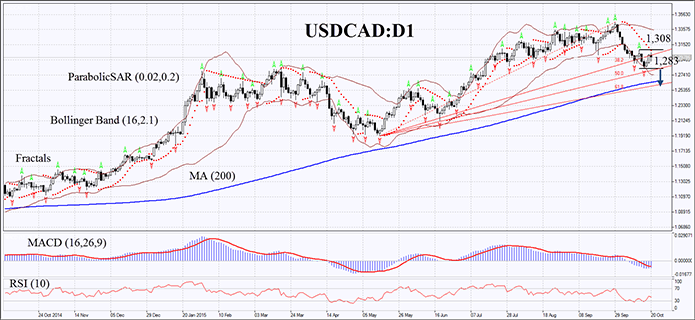
On the daily chart USDCAD:D1 is retracing down after a prolonged period of growth. The MACD and Parabolic indicators give sell signals. RSI is below 50, but still far from the oversold zone. The Bollinger lines have widened which means the higher volatility. The Bullish trend is probable in case the Canadian dollar slides down below the last Bill Williams fractal low at 1.283. This level can serve the point of entry. The initial risk-limits may be placed above the Parabolic signal and the last fractal high at 1.308. Having opened the pending order we shall move the stop to the next fractal high following the Parabolic and Bollinger signals. Thus, we are changing the probable profit/loss ratio to the breakeven point.
The most risk-averse traders may switch to the 4-hour chart after the trade and place there a stop-loss moving it in the direction of the trade. If the price meets the stop-loss level at 1.308 without reaching the order at 1.283, we recommend cancelling the position: the market sustains internal changes which were not taken into account.
| Position | Sell |
| Sell stop | below 1,283 |
| Stop loss | above 1,308 |
Market Analysis provided by IFCMarkets
Free Reports:
 Get Our Free Metatrader 4 Indicators - Put Our Free MetaTrader 4 Custom Indicators on your charts when you join our Weekly Newsletter
 Get our Weekly Commitment of Traders Reports - See where the biggest traders (Hedge Funds and Commercial Hedgers) are positioned in the futures markets on a weekly basis.