By IFCMarkets
Taking advantage of EIA forecast
Today we would like to present you the &NATGAS_OIL personal composite instrument (PCI) on the daily chart. The instrument’s base part contains 10 million British thermal units of natural gas (10 mmBtu), while the quoted one includes 1 barrel of Western Texas Intermediate oil (WTI).The base part is represented with the #C-NATGAS instrument, which is the continuous CFD for Henry Hub natural gas futures. The quoted part is represented with the OIL instrument, which is the continuous CFD for WTI oil futures. Analysts considered the opportunity to open a position after the August report by US Energy Information Administration (EIA). It cut the US oil production forecast by 100 thousand barrels daily to 9.4mln barrels in 2015 and by 400 thousand barrels daily to 9mln in 2016. We believe that reduced production may support WTI futures. At the same time EIA stated that as at July 31, 2015, natural gas reserves in the USA increased 23% as compared to the year before and advanced 2% above the 5-year average (2010-2014). EIA expects that by the winter season or late October natural gas supplies will reach the new historical high of 3867bln cubic feet. We suppose it may exert downward pressure on natural gas prices. Generally speaking, the NATGAS_OIL instrument may be traded lower in the future, if we take into account the forecast. We would like to remind you that the next EIA report will be published September 9, 2015.
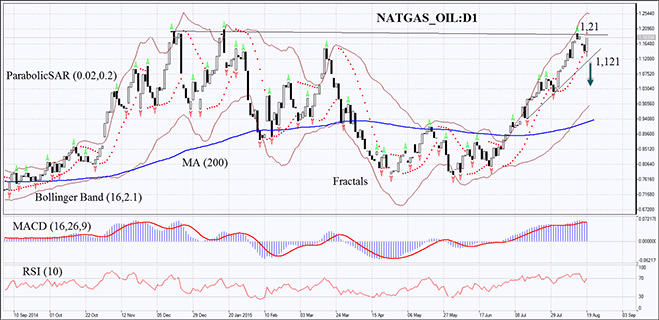
On the daily time frame the NATGAS_OIL:D1 significantly increased, reaching the current year high, which is a 5-year high as well. Yet, it did not manage to cross it. MACD and Parabolic shaped sell signals. Bollinger bands expanded, indicating high volatility. RSI-Bars has again hit the overbought zone. A bearish trend may develop if the PCI daily bar closes below Wednesday minimum and the second Parabolic signal at 1.121. A stop loss may be placed above the 5-year high, the latest fractal maximum and the upper Parabolic signal at 1.21. After pending order activation the stop loss is supposed to be moved every day to the next fractal high, following Parabolic and Bollinger signals. Thus, we are changing the probable profit/loss ratio to the breakeven point. The most cautious traders are recommended to switch to the H4 time frame and place a stop loss there, moving it after the trend. If the price reaches the stop loss without triggering the order, we recommend to cancel the position: the market sustains internal changes that were not considered.
| Position | Sell |
| Sell stop | below 1.121 |
| Stop loss | above 1.21 |
Market Analysis provided by IFCMarkets